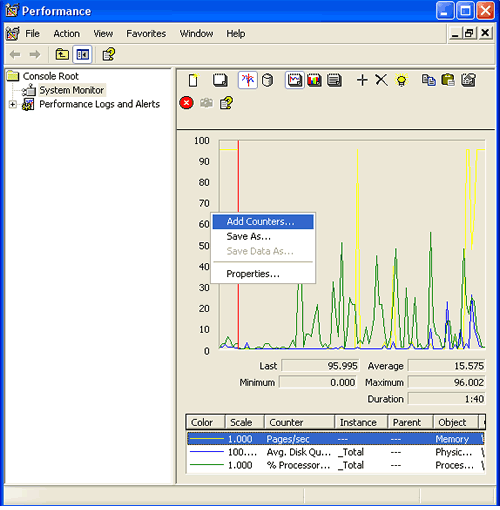
Grafana is an open-source data visualization and monitoring suite. It offers help for Graphite, Elasticsearch, Included, Prometheus, and much more databases. The application offers a stunning dashboard and metric analytics, with the potential to manage and create your personal dashboard to possess apps or infrastructure performance monitoring.
Here at Ibmi Media, as part of our Server Management Services, we regularly help our Customers to perform related System Monitoring queries on Linux machines.
In this context, we shall look into the process of installing Grafana on a Linux Mint 20 system.
Steps to Install Grafana on Linux Mint
To get Grafana installed on a Linux Mint 20 machine, you will have to perform the following steps.
1. Perform system update
To begin, you need to get your system updated with the below command:
$ sudo apt update2. Install Software Prerequisite / Packages
Next, you have to install some required packages with the following command:
$ sudo apt install apt-transport-https software-properties-common wget3. Import the GPG Key for Grafana:
After that, you need to import the GPG key for Grafana by running the below command:
$ wget –qO- https://packages.grafana.com/gpg.key | sudo apt-key add –The "OK" response in the output will represent a successful execution of this command.
4. Check if the GPG Key for Grafana has been imported successfully or not:
You can also confirm whether the GPG key for Grafana has been imported successfully or not by executing the following command:
$ echo “deb https://packages.grafana.com/oss/deb stable main” | sudo tee –a /etc/apt/sources.list.d/grafana.list5. Perform system update Again
You need to update the system again with the following command:
$ sudo apt update6. Install Grafana
Now, you need to install Grafana on your system with the below command:
$ sudo apt install grafana7. Reload the System Daemon
Now, you need to reload your system's daemon with the following command:
$ sudo systemctl daemon-reload8. Enable the Grafana Server
After that, you need to enable the Grafana server with the below command:
$ sudo systemctl enable grafana-server9. Start the Grafana Server
Finally, after enabling the Grafana server, you need to start it by running the following command:
$ sudo systemctl start grafana-server10. Check the Status of the Grafana Server
You can confirm whether the Grafana server is running actively or not by executing the below command:
$ sudo systemctl status grafana-serverNow you will see that the Grafana server is running actively on our Linux Mint 20 system.
How to Uninstall Grafana from Linux Mint 20 ?
If you want to remove the Grafana server from your system, then you can execute the below command:
$ sudo apt-get purge --autoremove grafana[Need assistance in fixing Installed packages errors in your Linux system ? We can help you. ]
Conclusion
This article covers how you can easily install Grafana on a Linux Mint 20 system. In fact, Grafana is capable of producing extremely fascinating charts and graphs with ability to manage and create your own dashboard for your apps or infrastructure performance monitoring.
This article covers how you can easily install Grafana on a Linux Mint 20 system. In fact, Grafana is capable of producing extremely fascinating charts and graphs with ability to manage and create your own dashboard for your apps or infrastructure performance monitoring.
