Are you trying to use Perfmon Counters for memory usage?
This guide is for you.
Memory is one of the important system resources that SQL Server uses to process their transactions. Sometimes, the server will face memory issues which in turn reduces the performance of running transactions.
We can use Windows PerfMon utility to gather current values of all given performance counters. This will help us to get a better understanding of the memory usage in the server.
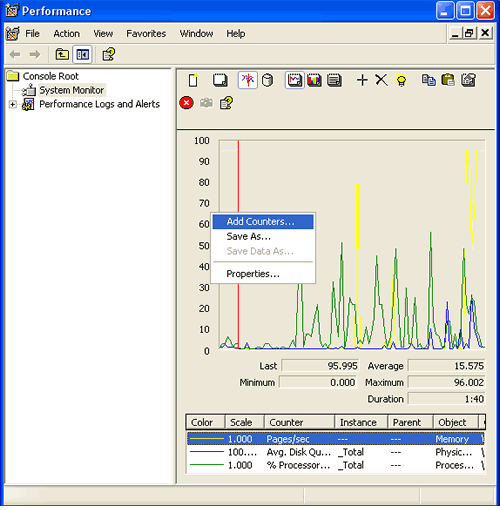
Performance Monitor (PerfMon) is a tool that comes built-in with Windows and allows you to look into the performance of your system and the applications that are running on it. It gives you a way to view data points that are associated with these applications and link them with the effect they have on your system.
Here at Ibmi Media, as part of our Server Management Services, we regularly help our Customers to perform SQl related tasks.
In this context, we shall look into some top performance counters to identify SQL Server Memory pressure.
Perfmon Counters for Memory Usage – Counters Available
We can run the below command to get all performance counters and their respective values using DMV sys.dm_os_performance_counters:
Select * from sys.dm_os_performance_countersBy default, SQL Server changes its memory requirements dynamically, on the basis of available system resources.
Some commonly used Perfmon Counters for memory usage:
1. Memory: Available Bytes
We can check the available memory with the help of counter Available Bytes under object Memory.
The low value of this counter shows the memory shortage on the server.
We can use this information to and ensure that memory bottlenecks do not happen in SQL Server.
2. Memory: Pages/sec
This counter indicates the total number of pages that are either read from the disk or written to the disk due to page fault.
When a process requests a data page that is not in memory, it will be taken from the disk to memory. This process is known as a page fault.
The high value of this counter could indicate excessive paging. The average Pages/sec value should be below 50. A high value of Pages/sec indicates intensive memory activities like reading from and writing to disk.
It means transactions are getting enough memory that is why they are using disk to process their requests.
3. Memory: Page Faults/sec
The high value of counter Memory: Pages/sec could indicate excessive paging. Next, we will monitor the Memory: Page Faults/sec counter to ensure that the disk activity is not because of paging.
This will give an exact picture of whether SQL Server is causing this paging issue or not.
4. Process: Working Set
Process: Working Set counter shows the amount of memory a process can use. This counter value shows whether we have set optimum value in min server memory and max server memory configuration or not.
If this value shows constantly below min server memory and max server memory then we can understand that we have set too much memory for the SQL Server.
5. SQL Server: Buffer Manager: Buffer Cache Hit Ratio
It is an important counter which shows the percentages of using data cache. If the value of buffer cache hit ratio for our server is 94 it means 94% of total requests for data have been processed using data cache.
The ideal value for this counter is more than 90. Higher the value better the memory health.
6. SQL Server: Buffer Manager: Page Life Expectancy
Page Life Expectancy is also an important counter for measuring memory pressure for the system. This counter indicates the average number of seconds in which a data page remains in the cache.
The ideal value is more than 300. But It is best to compare this value with the system configuration. Higher the value better the memory health.
7. SQL Server: Buffer Manager: Free List Stalls/sec
This counter helps to identify a sign of memory pressure or insufficient memory in the server. It displays the number of requests per second where data requests stall as there are no buffers available. Any value greater than two indicates that SQL Server needs more memory.
8. SQL Server: Buffer Manager: Lazy Writes/sec
This counter shows us the total number of Lazy writes performed in a second. It means the total number of times the Lazy Writer process moves dirty pages from the buffer to disk.
If the value of this counter shows a higher value continuously more than 20, we will have to increase the memory to the system or optimize memory-intensive operations.
9. SQL Server: Buffer Manager: Checkpoint Pages/sec
This counter monitors the number of dirty pages per second, which are flushed to disk when SQL Server invokes the checkpoint process. High values for this counter indicate memory pressure or insufficient memory.
10. SQL Server: Memory Manager: Memory Grants Pending
Generally counter shows the number of processes waiting for memory grants per second. A value higher than zero indicates a lack of memory.
11. Memory: Paging File(_Total)\% Usage
The percentage of the system page file that is currently in use can be seen with this counter.
12. Memory: Cache Bytes
The Memory pages that the System uses are split into two main counters, Cache Bytes and Pool Nonpaged Bytes.
The Cache Bytes counter shows the number of resident pages allocated in RAM that the Kernel threads can address without causing a Page Fault.
13. Memory: Pool Nonpaged Bytes
The Pool Nonpaged Bytes counter shows the number of resident pages in RAM that the Kernel is using that cannot be paged out.
14. Memory: Page Reads/sec
The Page Reads/sec is another counter to watch for memory issues. This counter is a complement to the Pages/sec counter since it shows how much the paging operations affect the disk.
15. Memory: Page Writes/sec
The Page Writes/sec is another counter to watch for memory issues. This counter is a complement to the Pages/sec counter since it shows how much the paging operations affect the disk.
[Need urgent Perfmon Counters Assistance? We are happy to help you. ]
Conclusion
This article will guide you on how to use Perfmon Counters for memory usage. You will also learn some commonly used performance counters which can be used to identify #SQL server memory pressure.
To detect a memory leak using #Performance #Monitor, monitor these counters: The Memory/Available Bytes counter lets you view the total number of bytes of available memory. This value normally fluctuates, but if you have an application with the memory leak, it will decrease over time.
A system performance report is a part of Performance Monitor that details the status of local hardware resources, system response times, and processes on the local computer. You can use this information to identify possible causes of performance issues.
SQL performance tuning consists of making queries of a relation database run as fast as possible.
To Check Detailed #Memory #Usage with Performance Monitor:
1. To open up Performance Monitor type: perfmon into the Run window (Windows Key + R).
2. In the window that comes up, click the Performance Monitor under Monitoring Tools in the left pane.
