Are you trying to know the process to measure storage performance and IOPS on Windows?
This guide is for you.
IOPS, however, are different; they are measured as an integer number. It refers to the maximum number of reads and writes to non-contiguous storage locations.
Here at Ibmi Media, as part of our Server Management Services, we regularly help our Customers to fix Windows related errors.
In this context, we will look into the steps to measure storage performance and IOPS on Windows.
The process of Capturing Storage I/O Using Disk Performance Counters in Windows?
Now let us take a look at how to measure the storage performance.
We can roughly estimate the current storage I/O workload in Windows using the built-in disk performance counters from Performance Monitor. To collect these counters data, we follow the below steps.
i. First, we start the Perfmon
ii. Next, we create a new Data Collector Set and select Create manually
iii. After that, we select the checkbox Create data logs >> Performance counter
iv. Now in the properties of the new data collection set, we add the following performance counters for the Physical Disk object:
Average Disk Sec/Transfer, Disk Bytes/sec, Average Disk Queue Length, Average Disk Bytes/Transfer, Disk Transfers/sec, Split IO/sec
v. Also, we can change other data collection properties. By default, counter values are collected every 15 seconds.
To display real-time disk performance, we need to add a specific Perfmon counter in the Monitoring Tools >> Performance Monitor section.
vi. Then it remains to start collecting performance counters data (select Start) and wait for the collection of sufficient information for analysis. After that, we right-click the data collector set and select Stop
vii. In order to view the collected performance data we go to the Perfmon >> Reports >> User Defined >> Data_Disk_IO >> check_the_last_set. By default, disk data displays as graphs.
viii. Finally, we use Ctrl + G to switch to the Report mode.
DiskSpd: Testing Disk Performance and IOPS in Windows
Microsoft recommends using the DiskSpd (https://aka.ms/diskspd) utility for generating a load on a disk system and measuring its performance. It is a command-line interface tool. Moreover, it can perform I/O operations with the specified drive target in several threads. We quite often use DiskSpd to measure the storage performance and get the maximum available read/write speed and IOPS from the specific server.
Moreover, the DiskSpd does not require installation. So we just download and extract the archive to a local disk. For x64 bit systems, we use the version of diskspd.exe from the amd64fre directory.
We use the following command to test the performance of the disk:
diskspd.exe –c50G -d300 -r -w40 -t8 -o32 -b64K -Sh -L E:\diskpsdtmp.dat > DiskSpeedResults.txtAfter the stress test completes, we can obtain the average storage performance values from the output tables.
In our test, the following performance data (check the Total IO table) was obtained:
MiB/s — 241 (about 252 Mb/s, not bad);
IOPS — 3866 (perfectly well!);
Average latency — 66.206 ms (quite a big latency!).
Also, we can get individual values for reading (section Read IO) or write (section Write IO) operations.
After testing several disks or storage LUNs using diskspd, we can compare them or select an array with the desired performance for tasks.
How to Measure Storage IOPS, Throughput, and Latency Using PowerShell?
First, we download the archive containing 2 files: SQLIO.exe and DiskPerformance.ps1 (disk_perf_iops.ZIP — 74 KB) and extract it to any folder.
Here is an example of running a PowerShell script to estimate disk performance and IOPS:
.\DiskPerformance.ps1 -TestFileName test.dat –TestFileSizeInGB 1 -TestFilepath C:\temp -TestMode Get-LargeIO -FastMode True -RemoveTestFile True -OutputFormat Out-GridViewIn our case (a vmdk virtual disk on the VMFS datastore on HP MSA 2040 connected over SAN is used) the disk array showed the average IOPS value of about 15,000 and the data transmission rate (throughput) about 5 Gbit/s.
[Need any further assistance in measuring storage performance in Windows? – We are here to help you.]
Conclusion
This article will guide you on the steps to measure storage performance and #IOPS on a #Windows server.
To calculate the IOPS range, use this formula: Average IOPS: Divide 1 by the sum of the average latency in ms and the average seek time in ms (1 / (average latency in ms + average seek time in ms).
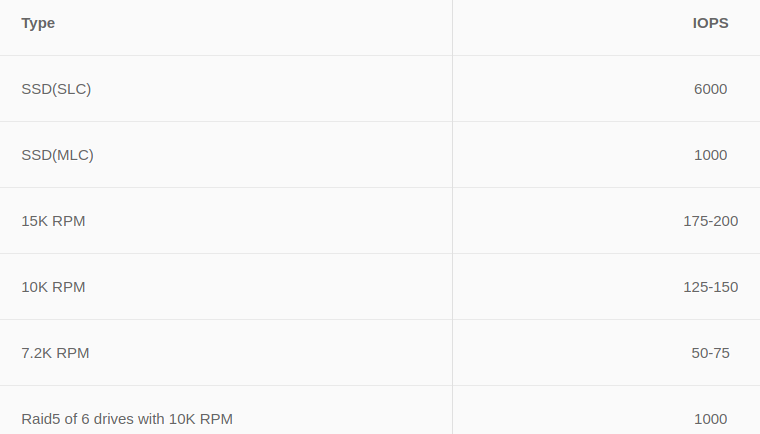
IOPS calculations;
1. Rotational speed (aka spindle speed).
2. Average latency.
3. Average seek time.
This article will guide you on the steps to measure storage performance and #IOPS on a #Windows server.
To calculate the IOPS range, use this formula: Average IOPS: Divide 1 by the sum of the average latency in ms and the average seek time in ms (1 / (average latency in ms + average seek time in ms).
IOPS calculations;
1. Rotational speed (aka spindle speed).
2. Average latency.
3. Average seek time.