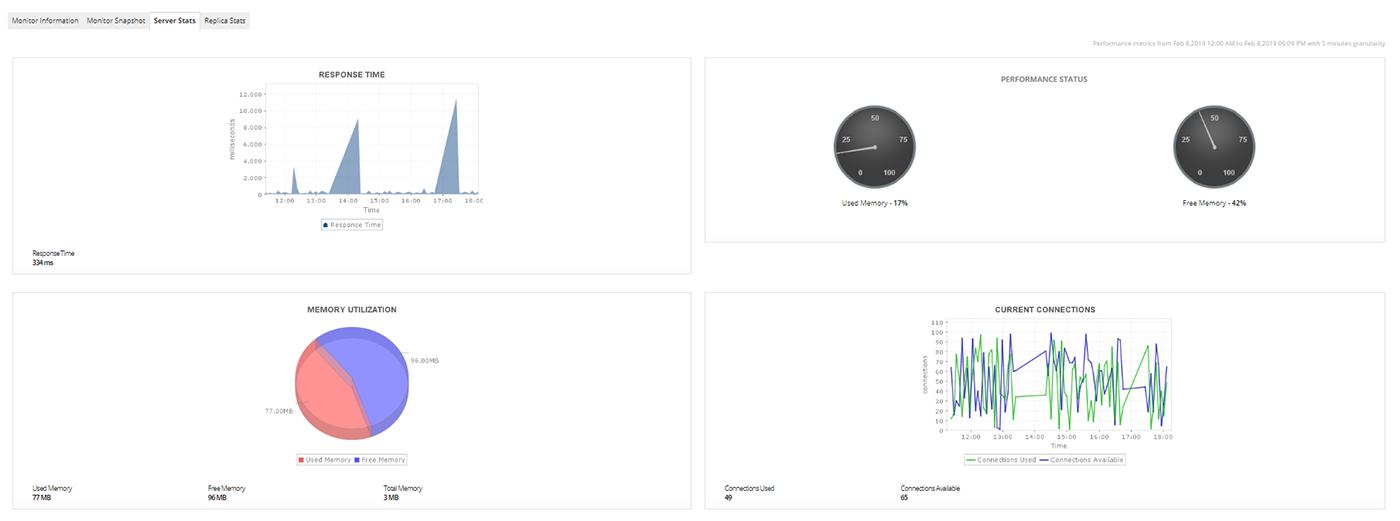
MongoDB provides various methods to retrieve and monitor MongoDB Performance.
Here at Ibmi Media, we regularly help our Customers to perform MongoDB related tasks as part of our Server Management Services.
In this context, we shall look into the useful tools to Monitor MongoDB Performance.
How to Monitor MongoDB Performance?
MongoDB is a favorite database for developers. Once we successfully deploy the database, we need to monitor its performance while it is running.
This is one of the most important tasks under "database administration".
The MongoDB database environment can be simple or complicated, local or distributed, on-premises, or in the cloud.
However, if we want to ensure a performant and available database, we should be tracking and monitoring analytics in order to:
i. Determine the current state of the database
ii. Review performance data to identify any abnormal behavior
iii. Provide some diagnostic data to resolve identified problems
iv. Fix small issues before they grow into larger issues
v. Keep your environment up and running smoothly
vi. Ensure ongoing availability and success
There are many things we can monitor in a MongoDB environment. Here are a few key areas.
We should be analyzing the following metrics:
1. Replication lag:
Replication lag refers to delays in copying data from the primary node to a secondary node.
2. Replica state:
This a method of tracking if secondary nodes have died. It also tracks if there was an election of a new primary node.
3. Locking state:
The locking state show set data locks and their length of time.
4. Disk utilization:
Disk utilization refers to disk access.
5. Memory usage:
Memory usages refer to how much memory is in use, and how it is in use.
6. Number of connections:
The number of connections the database has open in order to serve requests as quickly as possible.
[Need someone to monitor MongoDB? We are available 24*7.]
Useful tools to Monitor MongoDB Performance
Luckily enough, MongoDB provides various methods for retrieving its performance and activity.
Furthermore, let us look at monitoring utilities and database commands.
1. Mongostat
Mongostat is similar in functionality to vmstat monitoring tool, which is available on all major Unix-like operating systems.
It helps to get a quick overview of the status of our database. Mongostat provides a dynamic real-time view of a running mongod or mongos instance.
Similarly, it retrieves the counts of database operations by types, such as insert, query, updates, deletes, etc.
You can run mongostat as shown. If we have authentication enabled, we put the user password in single quotes to avoid any error.
$ mongostat -u “root” -p ‘=@!#@%$admin1’ –authenticationDatabase “admin”For more mongostat usage options, we type the following command:
$ mongostat –helpMongotop
Mongotop also provides a dynamic real-time view of a running MongoDB instance. It tracks the amount of time a MongoDB instance spends reading and writing data. It returns values every second, by default.
$ mongotop -u “root” -p ‘=@!#@%$admin1’ –authenticationDatabase “admin”Then, for more mongotop usage options, we type the following command.
$ mongotop –helpserverStatus Command
First, we need to run the following command to login into mongo shell.
$ mongo -u “root” -p ‘=@!#@%$admin1’ –authenticationDatabase “admin”Then, we run the serverStatus command. It provides an overview of the database’s state, by collecting statistics about the instance.
>db.runCommand( { serverStatus: 1 } )OR
>db.serverStatus()dbStats Command
The dbStats command returns storage statistics for a particular database, such as the amount of storage used, the quantity of data contained in the database, and object, collection, and index counters.
>db.runCommand({ dbStats: 1 } )OR
>db.stats()collStats
collStats command is to collect statistics similar to dbStats on the collection level. However, its output includes the size, the amount of disk space consumed, and information concerning its indexes, etc.
>db.runCommand( { collStats : “aurthors”, scale: 1024 } )replSetGetStatus Command
The replSetGetStatus command outputs the status of the replica set from the perspective of the server that processed the command. We must run this command against the admin database in the following form:
>db.adminCommand( { replSetGetStatus : 1 } )In addition, we can also use third-party monitoring tools either directly, or via their own plugins. These include mtop, Munin, and Nagios.
[Need help with the MongDB tasks? We’d be happy to assist]
Conclusion
This article will guide you on some useful monitoring utilities and #database commands for #reporting #statistics about the state of a running #MongoDB instance.
The motivation of the MongoDB language is to implement a data store that provides high performance, high availability, and automatic #scaling. MongoDB is extremely simple to install and implement. MongoDB uses JSON or BSON documents to #store #data.


