Analyzing logs with Nagios Log Server involves querying, filtering and drilling down the data in Nagios Log Server.
Here at Ibmi Media, as part of our Server Management Services, we regularly help our Customers to perform related Nagios queries.
In this context, we shall look into how to use queries and filters to see the exact information we are looking for using Nagios Log Server Dashboards.
How to analyze Logs With Nagios Log Server ?
Nagios Log Server is a powerful enterprise-class log monitoring and management application that allows organizations to quickly and easily view, sort, and configure logs from any source on any given network. One needs to be familiar with the Dashboard Menu for Analyzing logs with Nagios Log Server properly.
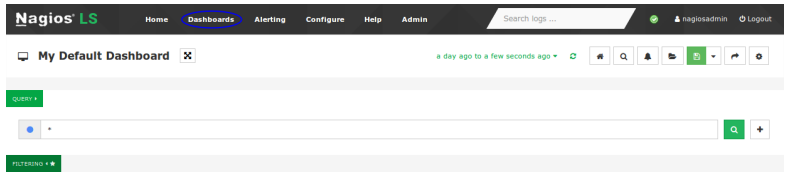
Let us first discuss the features that are located in the Dashboards menu, this is located on the top navigation bar.
1. Dashboards Menu
Dashboards allow us to create custom views of our log data that are based on queries and filters.
2. Time Period
The drop-down list at the top of the screen lets us select the time period for which we want the dashboard to apply to.
This is by default the past day (a day ago to a few seconds ago). When we click the refresh icon next to the list, the data on the screen will refresh while retaining any setting we have customized on the screen.
Using the drop down list allows us to select a pre-defined time range with the custom option available if one of those time frames does not meet our needs.
We can define this list of time frames by clicking the settings icon on the far right.
On the Timepicker tab, we can define these in the fields in the order that we want them to appear.
3. Row And Panel Overview
Rows and panels are the building blocks for creating dashboards comprised of graphs and tables. When we load the default dashboard, underneath QUERY and FILTERING is the following:
i. EVENTS OVER TIME and ALL EVENTS
ii. These are Panels and they are contained within a Row
iii. A row can have multiple panels
iv. Rows have a width of 12
v. Panels can be a size between 1 – 12, we could have three panels of sizes 3, 5 and 4
vi. By default, the panels EVENTS OVER TIME and ALL EVENTS have a width of 12.
A row can be collapsed to hide it temporarily from view. Click the play icon in the top box to collapse the row. Likewise, to expand it click the play icon.
4. Queries
When we start collecting log data over a long period of time, we will want to look at certain log types and categories. Nagios Log Server queries allow us to perform a search to show us the data we are looking for.
The graph view (events over time) shows us all the log data the server receives. This will display all log data in the database (last day by default) as the default query is an asterisk “*”. Through this view, we can see the log data traffic and trends in a somewhat birds-eye view for the last day.
Queries are not case-sensitive. When we query, Nagios Log Server will check every field in the Elasticsearch database for the string we are searching for.
We are not restricted to just one query. We can define multiple queries by clicking the + sign to the right of the Query field. By using multiple queries, Nagios Log Server sets each query as a different color, this helps to identify the different queries in the EVENTS OVER TIME graph and in other panels.
With the EVENT OVER TIME graph, we can also drag the mouse over a time period to zoom in for a closer look at those log events.
Queries that search for specific words searches all the fields in the Elasticsearch database for the time period we currently view. We can also perform the queries on specific fields.
To perform a query for a value in a specific field the syntax is as follows:
<field_name>:<query>
For example:
type:nagios_core
5. Filters
A filter is similar to a query. However, it reduces the amount of data that a query performs against. For example, we may only be interested in logs that have the severity_label of Notice.
The filter section is collapsed by default. Click the FILTERING icon to expand it and show the options available for filtering.
New filters can be added by clicking the + icon.
However, it can be much simpler to add a filter by using the data in the ALL EVENTS table. To view the data about a specific event, in the ALL EVENTS table click on a log entry.
The left column shows all the fields that are available for this specific log entry.
By clicking the spyglass icon for the severity_label field, we will create a MUST filter for the value of Notice.
Here we can see the newly added filter.
Here is another example. A filter was created by clicking the spyglass icon where the type is syslog. Now on the newly created entry, click the Edit icon.
The filter will now change to an edit mode. Use the field drop down list, select mustNot and then click Apply. The screen will refresh and the EVENTS OVER TIME and ALL EVENTS panels will apply the updated filters. We can see how using the spyglass on the ALL EVENTS table makes adding filters easy.
6. Filters
A filter is similar to a query. However, it reduces the amount of data that a query performs against. For example, we may only be interested in logs that have the severity_label of Notice.
The filter section is collapsed by default. Click the FILTERING icon to expand it and show the options available for filtering.
New filters can be added by clicking the + icon.
However, it can be much simpler to add a filter by using the data in the ALL EVENTS table. To view the data about a specific event, in the ALL EVENTS table click on a log entry.
The left column shows all the fields that are available for this specific log entry.
By clicking the spyglass icon for the severity_label field, we will create a MUST filter for the value of Notice.
Here we can see the newly added filter.
Here is another example. A filter was created by clicking the spyglass icon where the type is syslog. Now on the newly created entry, click the Edit icon.
The filter will now change to an edit mode. Use the field drop down list, select mustNot and then click Apply. The screen will refresh and the EVENTS OVER TIME and ALL EVENTS panels will apply the updated filters.
We can see how using the spyglass on the ALL EVENTS table makes adding filters easy:
i. Defining a Legend value makes it easy to identify the query when creating panels.
ii. The color selected is what appears in graphs and charts for this query.
When we click the Deactivate button, the query will not be part of the results in the other rows and panels. Deactivating allows us to temporarily stop using the query, it saves us from having to delete and re-add it.
The Pin button allows a query to be collapsed, useful in case of a large number of queries. The pinned queries appear next to the Pinned button. We can also click the Pinned button to hide the list of pinned queries.
7. Row And Panel Customization
Rows and panels are the building blocks for creating dashboards comprised of graphs and tables. Let us see how queries can be used to visualize our log data.
To create a new row, click the +Add Row link at the bottom right of the Dashboards page.
This will bring up the Dashboard Settings modal with the Rows tab selected. On the right, provide a Title for the row, define the height and then click the < Create Row button.
A newly created row is placed at the bottom of the Rows list. We can use the arrow icons to change the order in the rows are displayed on the dashboard.
This moves the New Row to the top of the list. Click the Save button to apply these changes to the dashboards page.
When we refresh the dashboard, we will see the row added.
8. Panels
The Row Settings modal appears with the Add Panel tab selected. We will need to select a panel type from the drop down list.
It shows all the options available for the panel type selected. Click the Save button to add the panel to the row.
When the dashboard refreshes, we will see the new panel added to the row.
For pie charts, if it shows the Legend value for the query on the pie chart itself, this makes it very easy for us to customize what we see. We can turn it off from the panel settings on the previous page. There is a Labels check box that can disable/enable this.
To add another panel, using the row options menu, click the bottom + option.
8. Panel Controls
Panels have four icons in the top right, as given below:
i. Inspect : Open a modal that shows how to obtain the panel data using a curl command
ii. Configure : Change any of the panel options, these are the same as when adding a panel
iii. Move : Use the mouse to move the panel to a different row location, either on the same row or another row
iv. Remove : Delete the panel
9. Configure Row
To change the settings of a row, use the row options and click the Configure row icon. This will bring up the Row Settings modal.
10. Dashboard Controls
The top of the Dashboards page has a common set of controls, as given below:
i. Toggle Fullscreen/Exit Fullscreen – The fullscreen mode removes the top menu bar and the bottom status bar
ii. Home – It loads the dashboard saved as the default. This can be changed via Save (drop down) > Advanced > Set as Default Dashboard
iii. Manage Queries – This icon brings up the manage queries modal.
iv. Create an alert – This allows us to create an alert using the current query.
v. Load – Load any dashboard that we previously saved. Clicking the icon presents a drop down menu with all the dashboards that we have saved. Click a dashboard to load it. The icon to the left of the dashboard title indicates the Global dashboards. We can delete a dashboard from the load list by clicking the to the right of the dashboard title. Use with caution as we cannot recover a deleted dashboard. The Advanced link at the bottom of the list allows us to import a dashboard from a file.
vi. Save – This saves all the customization we have made such as queries, filter, graphs, tables, colors etc. The icon will have a red color when there are changes to our dashboard that have not been saved. If we have not saved the current dashboard with a name, click the drop-down arrow and then, type a name for the dashboard and vii. click the appropriate save button.
viii. Share – Provides us with a URL that we can give to other users to access our dashboard. The user needs a Nagios Log Server user account to view the URL.
ix. Configure – Displays the Dashboard Settings modal for the current dashboard.
11. Manage Queries
To save our current dashboard, query type a value in the top field and then click the Create button. We can optionally check the Make global box to save the query for other users to access (only Admins can create global queries).
The Import button allows us to import a saved query from file.
In the list of queries, in the Name column if we click the icon it will load the query into our dashboard. Be aware that this will overwrite the existing queries already defined in our dashboard.
The Actions column provides the following:
i. Export – Export the current query to a file.
ii. Overwrite – Overwrite this saved query with the contents of our current dashboard.
iii. Delete – Delete the saved query. Use with caution as we cannot recover a deleted query.
[ Need any further assistance in analyzing logs with Nagios Log Server? – We're available 24*7. ]
Conclusion
This article covers how to analyze logs with Nagios Log Server. Basically, in order to analyze logs with Nagios Log Server one needs to be familiar with the options in the Dashboards menu. This guide is very essential to Nagios Log Server administrators and users looking for information on querying, filtering and drilling down the data in Nagios Log Server.
You can audit your IT infrastructure, maintain historical records of usage of IT infrastructure, create reports, and analyze logs using the Nagios Log Server.


