We send ESXi Syslog messages to Nagios Log Server for storage and analysis.
Here at Ibmi Media, as part of our Server Management services, we regularly help our Customers to perform related Nagios queries.
In this context, we shall look into how to configure the VMware ESXi server to send Syslog messages to Nagios Log Server.
How to Send ESXi logs to Nagios log server ?
Here, we will consider the following areas:
- Create input for UDP 514 and TCP 1514 ports.
- Configure Firewall Rules on Nagios Log Server.
- Configure ESXi to send Syslogs to Nagios Log Server.
1. Create Input UDP 514
To use UDP 514, we need to configure our Nagios Log Server to listen on privileged ports.
i. Initially, we login to Nagios Log Server
ii. Then we navigate to Configure > Global (All Instances) > Global Config.
iii. Here, we click the + Add Input button and select Custom.
iv. We will have a new block at the bottom of the list of Inputs.
v. Type a unique name for the input which will be Syslog (ESXi).
vi. In the text area field, enter the following code:
syslog {
type => ‘syslog-esxi’
port => 514
}
vii. Finally, click the Save & Apply button to create and apply the configuration.
viii. In addition, we need to create a firewall rule to allow the incoming UDP traffic:
RHEL 7+|CentOS 7+|CentOS Stream
# firewall-cmd –zone=public –add-port=514/udp
# firewall-cmd –zone=public –add-port=514/udp –permanent
Debian:
Debian does not enable the local firewall by default. So no steps are required here. If it is enabled, then the command is:
# iptables -I INPUT -p udp –destination-port 514 -j ACCEPT
Ubuntu:
Similarly, if the local firewall is enabled on Ubuntu by default, then the commands are:
# sudo ufw allow 514/udp
# sudo ufw reload
2. Create Input TCP 1514
i. Login to Nagios Log Server and navigate to Configure > Global (All Instances) > Global Config.
ii. Click the + Add Input button and select Custom.
iii. A new block will appear at the bottom of the list of Inputs.
Type a unique name for the input which will be Syslog (ESXi). In the text area field, enter the following code:
syslog {
type => ‘syslog-esxi’
port => 1514
}
iv. Eventually, click the Save & Apply button to create this input and apply the configuration.
v. In addition, we create a firewall rule to allow the incoming TCP traffic:
RHEL 7+|CentOS 7+|CentOS Stream
# firewall-cmd –zone=public –add-port=1514/tcp
# firewall-cmd –zone=public –add-port=1514/tcp –permanent
Debian:
If the local firewall is enabled. then the command is:
# iptables -I INPUT -p udp –destination-port 1514 -j ACCEPT
Ubuntu:
If the local firewall is enabled in Ubuntu, then the commands are:
# sudo ufw allow 1514/udp
# sudo ufw reload
3. Configure ESXi
i. Initially, we open the vSphere Client to the ESXi server.
ii. Then we select the ESXi host in the inventory pane.
iii. Here, we click the Configuration tab on the right.
iv. Under Software, we click Advanced Settings.
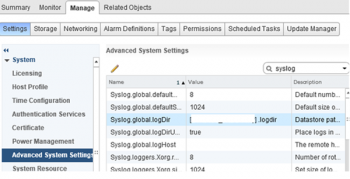
v. Then, Expand Syslog and click global.
vi. For UDP 514 change Syslog.global.logHost to: udp://xxx.xxx.xxx.xxx:514
vii. For TCP 1514 change Syslog.global.logHost to: tcp://xxx .xxx.xxx.xxx:1514
viii. Click OK.
ix. Then under Software click Security Profile.
x. For Firewall, we click Properties.
xi. Find Syslog and Tick the box.
xii. Finally, click OK.
In the steps above, the xxx.xxx.xxx.xxx is the IP Address of Nagios Log Server.
4. Check Nagios Log Server
We need to confirm that Nagios Log Server receives data from the ESXi server navigate to the Dashboards page.
We perform a Query on the host field using the IP Address of our ESXi host: host:<ESXi Host Address>.
The results appear in the ALL EVENTS panel. If we see the results then everything should work correctly.
5. Advanced Configuration
If we already have an existing SYSLOG input for UDP 514 or TCP 1514 then we need to define a filter. It defines the type as syslog-esxi for the received ESXi logs.
We need this because the ESXi Syslog date format may be slightly different from that of other Syslog data.
This may cause problems with the indices created every day by Elasticsearch.
The filter we create requires that the addresses of all ESXi hosts sending syslogs to Nagios Log Server be defined as part of the filter.
6. For example, we will use the addresses 10.25.6.145 and 10.25.6.146.
i. In Nagios Log Server, we navigate to Configure > Global (All Instances) > Global Config.
ii. Then click the + Add Filter button and select Custom.
iii. We will have a new block at the bottom of the list of filters.
Here, we type a unique name for the filter which will be ESXi.
In the text area field, we enter the following code:
if [host] == ‘10.25.6.145’ or [host] == ‘10.25.6.146’ {
mutate {
replace => { ‘type’ => ‘syslog-esxi’ }
}
}
iv. Click the Save & Apply button to create and apply the configuration.
v. Once done, we should proceed to the Configure ESXi section.
[Need help with ESXi logs queries? We are here for you. ]
Conclusion
This article covers how to go about Sending ESXi logs to Nagios log server.
To Send ESXi Logs To Nagios Log Server:
1. Login to Nagios Log Server and navigate to Configure > Global (All Instances) > Global Config.
2. Click the + Add Input button and select Custom.
3. A new block will appear at the bottom of the list of Inputs.
4. Type a unique name for the input which will be Syslog (ESXi).
