Sometimes Website Owners face issues with the performance graph in Nagios which makes it not to display accurate data.
Here at Ibmi Media, as part of our Server Management Services, we regularly help our Customers to fix Nagios related errors.
In this context we shall look into what causes this error and how to tackle it.
What triggers performance graph problems in Nagios?
As earlier stated, sometimes Webmasters see that the performance graphs in Nagios are not displaying data when their checks are returning true performance data.
When the performance data feature is enabled, Nagios generates performance graphs, which are updated automatically with the execution of a single check process.
When executed, the "performance data" is displayed and the result is stored within RRD databases.
Basically, in the RRD Databases, Data sources are at fixed positions. However, after updates of Nagios checks the number or the names of data sources of a check result may change.
As a result, this issue will occur and the performance graph will fail to update as it should.
Steps to fix performance graph issues in Nagios?
To troubleshoot the performance graph problems in Nagios, apply the following tips;
1. Check that Performance Data is enabled
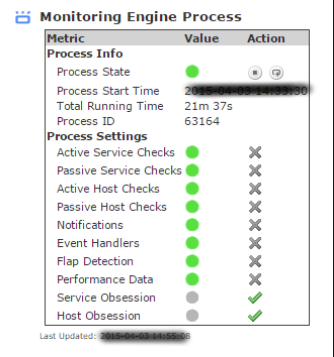
To start with, ensure that the Performance data is enabled.
To do this, navigate to "Admin > System Information > Monitoring Engine Status".
Now make sure the Performance Data process is green.
2. Count The Amount Of Spooled Files
Generally, Nagios spools performance data into small files. Sometimes it stops processing these files and these files begin to spool up.
With the following commands, you can count the number of files in these locations:
ls /usr/local/nagios/var/spool/perfdata/ | wc -l
ls /usr/local/nagios/var/spool/xidpe/ | wc -l
If the number of files is greater than 20,000, it is more likely for the processes to get caught in a loop. Thus, we will need to delete them.
To delete a large number of files in a directory, execute the following command:
find /usr/local/nagios/var/spool/perfdata/ -type f -deleteAfter deleting the files, wait for about thirty minutes (30) to see if performance graphs start to work.
3. Increase Performance Data Logging Verbosity
If deleting the spooled files does not help, then you need to increase the Performance Data Logging Verbosity.
Now, modify the following file from an SSH session and change the LOG_LEVEL value fro 0 to 2;
/usr/local/nagios/etc/pnp/process_perfdata.cfgThe process_perfdata.pl script should now log all errors and debug information to the file /usr/local/nagios/var/perfdata.log. To watch it, execute the following command;
tail -f /usr/local/nagios/var/perfdata.logLook for any errors, incorrect exit codes, and/or timeouts.
Do no forget to return this value to its default setting after completing.
A very common error found in this log is the typical timeout error. To fix it temporarily, we can increase the performance data processor’s timeout range by changing the TIMEOUT field in the process_perfdata.cfg file.
4. Increase NPCD Logging Verbosity
NPCD is a bulk processing tool which reaps and processes the performance data. To increase its logging verbosity edit the following file in an SSH session and change the log_level field from 0 to -1:
/usr/local/nagios/etc/pnp/npcd.cfgThen, restart the NPCD service using the restart command.
Also. remember to return this value to its default setting after completing troubleshooting.
NPCD should now log all errors and debug information to the file /usr/local/nagios/var/npcd.log file. We can watch it using this command:
tail -f /usr/local/nagios/var/npcd.logA common error that we may find in the log file is the one indicating that we are hitting a load threshold.
We can increase this threshold by editing the following file and changing the load_threshold value to a higher one:
/usr/local/nagios/etc/pnp/npcd.cfg
5. Checking Nagios User Account
In some situations, the Nagios user account can expire causing issues like this to occur. Thus, we can run this command to see if the Nagios user account expired:
chage -l nagiosTo enable the expired Nagios user, execute the following command;
chage -I -1 -m 0 -M 99999 -E -1 nagiosNeed support in fixing Nagios errors? We are available to help you today.
Conclusion
This article will help to fix performance issues in Nagios when performance graphs does not display the correct data even though their checks return true performance data.
This article will help to fix performance issues in Nagios when performance graphs does not display the correct data even though their checks return true performance data.


