For monitoring squid proxy server with Nagios log server, we first download filter, create a filter and then configure Squid Server to send the Logs.
Here at Ibmi Media, as part of our Server Management Services, we regularly help our Customers to fix Nagios-related configurations.
In this context, we shall look into the steps to monitor the squid proxy server with Nagios log server.
How to monitor squid proxy server with Nagios log server ?
Here you will learn how to integrate a Squid Proxy server logs into Nagios Log Server.
We look into the details of how to configure a server running Squid to send logs to the Nagios Log Server, and how to configure the Filters in the Nagios Log Server to parse the logs from Squid.
The Nagios Log Server manages logs that will allow Admins using Squid Proxy server to quickly and easily see what is accessed and request from users. Here we are considering an example which is using CentOS 7 server with a Squid Proxy server installed via yum.
For this example:
• The default logs are in /var/log/squid/
• There are two log files
◦ access.log = logs web requests and results
◦ cache.log = logs the error and debug message from squid
Download Filter for Nagios Log Server ?
As a first step, we download a filter. A Filter is how the received log data is broken up into fields that are stored in the Elasticsearch database. It makes use of regular expressions to break apart the data and hence can be quite complicated.
For that, we navigate to the following URL:
https://github.com/T-M-D/NLS-Collection/blob/master/Filters/Squid.txtNext, we copy everything from this line to the end of the file into the clipboard:
if [program] == ‘squid_access’ {We will paste this into the new filter that we will create in the next step.
Create Filter for Nagios Log Server ?
i. Now, we open the web interface for our Nagios Log Server instance as an administrator.
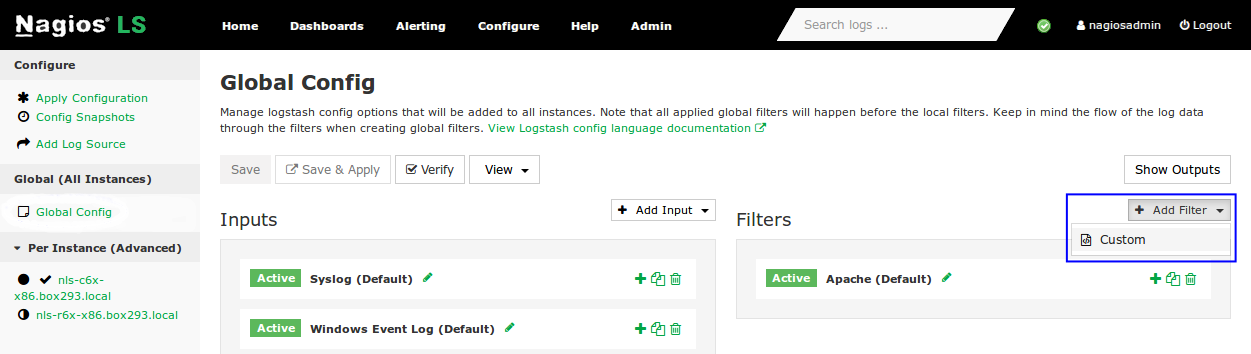
ii. Next, we navigate to Configure >> Global (All Instances) >> Global Config.
iii. On the right side of the page, we click the ‘+ Add Filter’ button and select ‘Custom’.
A new filter appears. Here we need to provide a title in the Block Name field. Then in the text area field, we paste the filter that we previously copied into our clipboard.
iv. Finally, we click the Save button to create a new filter.
v. At this point, we click the Verify button to ensure the filter we just created is valid or not.
Once the verification is successful, we apply the configuration. In the left pane under Configure click Apply Configuration. We click the Apply button and then click ‘Yes, Apply Now’ when prompted.
How to Configure Squid Server to send the Logs ?
Now after creating the filter, we need to configure the Squid server to send the access.log and cache.log files to the Nagios Log Server instance.
Note: In the following steps we have replaced xxx.xxx.xxx.xxx with the address of the Nagios Log Server instance that will be receiving the logs.
First, we establish a terminal session to our Nagios XI or Nagios Core server and execute the following commands:
# cd /tmp
# curl -s -O http://xxx.xxx.xxx.xxx/nagioslogserver/scripts/setup-linux.sh
# bash setup-linux.sh -s xxx.xxx.xxx.xxx -p 5544 -f /var/log/squid/access.log -t squid_access
# bash setup-linux.sh -s xxx.xxx.xxx.xxx -p 5544 -f /var/log/squid/cache.log -t squid_cache
After executing these commands the Squid server will send the Squid logs to the Nagios Log Server. So now we can search for squid on the Dashboards page and see the results coming in, confirming that everything is correctly configured.
Dashboards layout ?
Once we receive some log data we will be able to visualize that data using panels.
i. So we start off by adding a new row.
At the bottom right of the screen click the ‘+ ADD A ROW’ link.
ii. Here, we give the row a Title and then click the Create Row button.
iii. Next, we use the up arrow icon to move it to the top of the list.
iv. Finally, we click Save.
On the new row, we click the ‘Add panel to empty row’ button.
v. Under ‘Select Panel Type’, we choose terms
vi. Next, we give it the title of HTTP Method
vii. Field = http_method
viii. Style = pie
ix. Finally, we click Save
After that, we click the ‘Add Panel’ button.
i. Under ‘Select Panel Type’, we choose histogram
ii. Next, we give it the title of Request Time. Then for the below options, we provide:
iii. Chart value = total
iv. Value Field = request_msec
v. Chart Options
vi. Un-check Bars
vii. Check Lines
viii. Finally, we click Save
ix. Click the ‘Add Panel’ button
Under ‘Select Panel Type’, we choose terms
i. Next, we give it the title of Protocols
ii. Field = protocol
iii. Style = table
iv. Click Save
[Need urgent assistance with Nagios related queries? – We are here to help you. ]
Conclusion
This article will guide you on how to configure the #Nagios log server to use a #proxy server.
#Squid is a caching and forwarding #HTTP web proxy. It has a wide variety of uses, including speeding up a web server by caching repeated requests, #caching web, #DNS and other computer network #lookups for a group of people sharing network resources, and aiding security by filtering #traffic.


