Monitoring Performance Counters in Nagios XI is possible using NCPA.
Here at Ibmi Media, as part of our Server Management Services we regularly help our Customers to fix Nagios related issues.
In this context, we shall look into how to use NCPA to monitor servers.
The Process of Monitoring Performance Counters in Nagios ?
Here, you will learn how we can monitor Windows Performance Counters in Nagios XI.
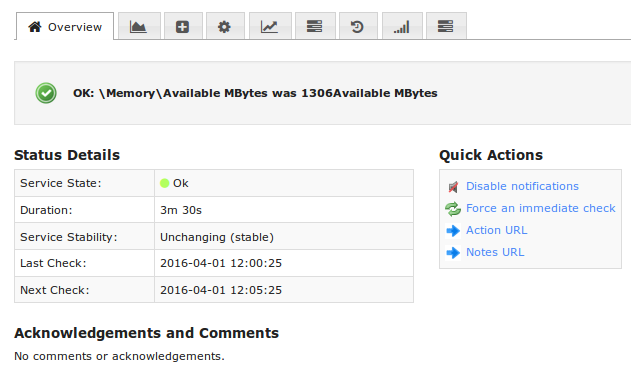
To begin with, let us focus on the following performance counter:
"\Memory\Available MBytes"
This is referenced by NCPA in the following format:
'windowscounters/Memory/Available%20MBytes'
The warning threshold will be set to 500 and critical 256.
We need to install NCPA to be able to monitor performance counters in Nagios XI.
We can download NCPA packages for our operating system (OS) from the URL:
https://www.nagios.org/ncpa/#downloads
To install NCPA On Windows;
i. We navigate to the location of the download and double-click the installer.
ii. Eventually, the Welcome screen will pop up.
iii. Click Next to continue. Then, we can see the license agreement.
iv. Here we click I Agree
v. Then, we can see the configuration screen for Passive checks.
The only setting we need is a Token. This is what Nagios server will use to authenticate with NCPA.
The Bind IP of 0.0.0.0 means that NCPA will listen on all Ipv4 addresses on the Windows machine.
It uses the default port of 5693.
Click Next to proceed. Then, we can see the configuration screen for Passive checks.
We need to check the Send passive checks over the NRDP box to enable passive checks.
Similarly, we will also need to provide the following NRDP settings:
URL
This is the URL on Nagios Host that accepts passive check results to submit.
NRDP Token
This is the token that we use when passing NCPA passive checks to Nagios for NRDP to accept the check.
The URL and NRDP token in Nagios XI is configured via Admin > Check Transfers > Inbound Transfers.
Hostname
The hostname that the passive checks belong to on the Nagios server.
i. Click Next to proceed.
Continuing with Passive checks, we will present the default passive service checks that will execute and send to the Nagios server.
ii. However, we can change it, as per our requirements.
iii. Then, click Next to proceed.
iv. Now, we will have the install location. Change the destination folder as per requirement.
v. Then click the Install button to install NCPA. Then, wait for the installation and configuration of NCPA.
vi. Once done, click Finish.
We will also need to monitor the host by Nagios XI. For example, here the host is win7-01 and the host has the token uumrdrd3p704.
Create the Service
i. Click the Configure menu
ii. Then click Core Configuration Manager
iii. In the left pane under Monitoring click Services
iv. Then, click the Add New button
v. Populate the fields on each tab as follows:
Common Settings:
Config Name: win7-01
Description Memory: Available
Manage Hosts button: Select win7-01
Manage Templates button: Select xiwizard_ncpa_service
Check command: check_xi_ncpa_agent
$ARG1$: -t 'uumrdrd3p704' -P 5693 -M 'windowscounters/Memory/Available%20MBytes' -w 500: -c 256:
Check Settings:
Check interval: 5
Retry interval: 1
Max check attempts: 5
Check period: xi_timeperiod_24x7
Alert Settings:
Complete any notification options as required.
i. Click Save
ii. Then, click Apply Configuration
iii. Now, click the magnifying glass on the right of the menu bar.
iv. Search for Memory Available
v. In the search result, click on the new service Memory Available.
[Couldn't configure NCPA in Nagios? We'd be happy to assist!]
Conclusion
This article will guide you on how to configure #Nagios XI to monitor performance counters by monitoring Performance Counters in Nagios XI is possible using #NCPA as well as use cases where real-time monitoring actually provides no benefit at all, and may also be both a distraction and a detriment to monitoring #teams and #admins.
This article will guide you on how to configure #Nagios XI to monitor performance counters by monitoring Performance Counters in Nagios XI is possible using #NCPA as well as use cases where real-time monitoring actually provides no benefit at all, and may also be both a distraction and a detriment to monitoring #teams and #admins.


