Are you trying to integrate SNMP traps with Nagios?
This guide is for you.
Nagios provides complete monitoring of SNMP (Simple Network Management Protocol). SNMP is an “agentless” method of monitoring network devices and servers, and is often preferable to installing dedicated agents on target machines.
Here at Ibmi Media, as part of our Server Management Services, here at Ibmi Media, We regularly help to perform Nagios-related queries.
In this context, we shall look into how to integrate SNMP traps with Nagios.
How to integrate SNMP traps with Nagios ?
Here, we will configure Nagios XI to receive and process SNMP traps from external devices.
Getting started with Nagios XI Trap Interface (NXTI).
NXTI was introduced with Nagios XI 5.5. It is enabled with the Enterprise edition license of Nagios XI. Also, it provides an easier way of configuring and managing traps through the Nagios XI web interface.
In case, if you have an Enterprise edition license then we recommend using NXTI.
Intermediary Firewalls
We would first need to configure any intermediary firewalls between the Nagios XI server and the remote device to allow inbound SNMP traps to be sent to Nagios XI before we can configure remote devices to send SNMP traps to Nagios XI.
Here we need to allow UDP port 162 traffic from remote devices to the Nagios XI server.
However, we need to make a note that Nagios XI is the server (rather than the client) for SNMP traps, so the packet flow is inbound to the Nagios XI machine.
Nagios XI is automatically configured with a firewall rule to allow UDP port 162 inbounds, there is no additional configuration required on the Nagios XI server.
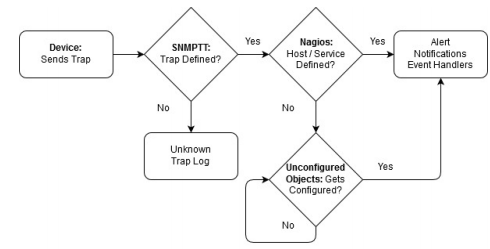
More about SNMP Trap Translator (SNMPTT) ?
SNMPTT is one that is responsible for processing the received traps and decides if they should be sent to Nagios XI.
The SNMPTT checks the incoming traps against existing trap definitions. If the incoming trap matches an incoming definition, it passes the trap to Nagios XI, where the trap receives standard Nagios treatment:
1. Event is logged.
2. Alert is generated.
3. Notifications/Event Handlers (or both) occur.
4. If the incoming trap does not match an incoming definition, the trap is sent to the Unknown Trap Log.
i. Unconfigured Objects are handled with the SNMP Trap Wizard.
Defining Traps
We can create the trap definitions in the following ways;
i. We can create it from a MIB we upload to Nagios XI.
ii. In a case where either no MIB exists, or the existing MIB does not define a required trap, we can define the trap in the etc/snmp/snmptt.conf file.
iii. Also, this is how we can define custom/complex trap definitions.
How to install MIBs ?
If the remote device we are sending traps from has a MIB file then we can upload this MIB file to configure SNMPTT on the Nagios XI server to understand these incoming traps. We can do this via Admin >> System Extensions >> Manage MIBs.
Then click the Browse button to find the MIB to be added. After that, we check the box Process trap and then click the Upload MIB button.
This will find any trap definitions in the MIB file and add them to the /etc/snmp/snmptt.conf file. They will be added to this file as an EVENT. Also, the MIB will be copied into the /usr/share/snmp/mibs/ directory. If we had previously uploaded a MIB file, but did not select the Process trap check box, we can run the following command in a terminal session:
addmib <PathToNewMIB>
For example:
addmib /usr/share/snmp/mibs/NAGIOS-NOTIFY-MIB.txtHow to define Traps In snmptt.conf ?
Usually, trap definitions are defined in the /etc/snmp/snmptt.conf file. They always start with an EVENT line and are followed by a FORMAT line and an EXEC line. There are other lines that will exist but are not mandatory. For example, anything between SDESC and EDESC purely comments information and is not processed as part of the trap.
More about SNMPTT Processing Behavior ?
Normally, SNMPTT will compare a received trap against every EVENT in the snmptt.conf file. Multiple EVENTS with the same OID/MIB can exist. Hence execution of multiple EXEC statements can be done. However, the SNMPTT does not stop looking through the snmptt.conf file once an EVENT is matched.
This behavior allows for more complicated EVENTs that have filters applied using MATCH lines. If we have two identical EVENTS, it is possible that we will submit two traps to Nagios XI at the same time and the last trap received will overwrite the previous one.
How to Send Test SNMP Trap ?
Sending a test trap to Nagios XI to demonstrate how traps are received by Nagios XI is quite easy. In a terminal session, we execute the following command:
snmptrap -v 2c -c public 127.0.0.1 ” linkUp ifDescr s eth0 ifAdminStatus i 1 ifOperStatus i 1Once we execute this command, we will see the following logged in the /var/log/snmptt/snmptt.log file:
Mon Dec 28 11:15:42 2020 .1.3.6.1.6.3.1.1.5.4 Normal “Status Events” localhost
– Link up on interface eth0. Admin state: up. Operational state: up
We will also see the following logged in the /usr/local/nagios/var/nagios.log file:
[1480298939] Warning: Passive check result was received for service ‘SNMP
Traps’ on host ‘localhost’, but the service could not be found!
[1480298939] Error: External command failed ->
PROCESS_SERVICE_CHECK_RESULT;localhost;SNMP Traps;0;Link up on interface eth0.
Admin state: up. Operational state: up / ifDescr (OCTETSTR):eth0
ifAdminStatus (INTEGER):up ifOperStatus (INTEGER):up
Nagios XI has now received the SNMP Trap. However as we can see from the message above, it is reporting that the SNMP Traps service could not be found. The next step will show how to use the SNMP Trap wizard to create this service in Nagios XI.
How to use the SNMP Trap Wizard ?
We must have the SNMP Traps service defined in Nagios XI for each host or device that we wish to receive and process SNMP traps. Nagios XI has a built-in wizard that makes the configuration of these SNMP trap events quick and simple.
For that;
1. Navigate via the top menu bar to Configure >> Run a configuring wizard and select the SNMP Trap wizard.
2. The first screen says ‘This wizard allows you to enable SNMP Traps for existing hosts that are being monitored’. We click Next to continue.
3. The wizard will then ask us which host we wish to add an SNMP trap service to. When we have selected all the hosts we want, we click Next.
Then we complete the wizard by choosing the required options in Step 3 – Step 5.
To finish up, we click on Finish in the final step of the wizard. This will create the new service called SNMP Traps and will be waiting to receive a trap.
Once the wizard applies the configuration, we click the View status details for the localhost link to see a new service that was created.
How to Send Test SNMP Trap ?
We send a test trap to see how it is received in XI. In a terminal session we execute the following command:
snmptrap -v 2c -c public 127.0.0.1 ” linkUp ifDescr s eth0 ifAdminStatus i 1 ifOperStatus i 1As a result, we can see the service update.
Being a linkUp trap the service was submitted with an OK status. This is because the EVENT line ends with Normal (OK in Nagios XI) and the EXEC line sends the Normal state with the “$s” variable:
EVENT linkUp .1.3.6.1.6.3.1.1.5.4 “Status Events” Normal
FORMAT Link up on interface $1. Admin state: $2. Operational state: $3
EXEC /usr/local/bin/snmptraphandling.py “$r” “SNMP Traps” “$s” “$@” “$-*”
“Link up on interface $1. Admin state: $2. Operational state: $3″
Now we send a test trap for a linkDown and we will be able to see how it is received in XI. In a terminal session execute the following command:
snmptrap -v 2c -c public 127.0.0.1 ” linkDown ifDescr s eth0 ifAdminStatus i 2 ifOperStatus i 2Once we execute this command, we will see the service update.
Being a linkDown trap the service was submitted with a CRITICAL status. This is because the EVENT line ends with Critical and the EXEC line sends the CRITICAL state with the “$s” variable:
EVENT linkDown .1.3.6.1.6.3.1.1.5.3 “Status Events” Critical
FORMAT Link down on interface $1. Admin state: $2. Operational state: $3
EXEC /usr/local/bin/snmptraphandling.py “$r” “SNMP Traps” “$s” “$@” “$-*”
“Link down on interface $1. Admin state: $2. Operational state: $3″
The SNMP Traps service will stay in a CRITICAL state until it receives the next trap.
[Need urgent assistance with Nagios related queries? – We are here to help you. ]
Conclusion
This article will guide you on how to integrate SNMP traps with #Nagios. #SNMP can comprehensively monitor not only the network elements like #routers and #switches, but can also be used to monitor #network servers. Details like server hardware description, physical location, IP address, available disk space and server uptime can be monitored through SNMP.
This article will guide you on how to integrate SNMP traps with #Nagios. #SNMP can comprehensively monitor not only the network elements like #routers and #switches, but can also be used to monitor #network servers. Details like server hardware description, physical location, IP address, available disk space and server uptime can be monitored through SNMP.


