Azure Cache for Redis uses Azure Monitor to provide several options for monitoring your cache instances. With it, you can easily view metrics, pin metrics charts to the Startboard, customize the date and time range of monitoring charts, add and remove metrics from the charts, and set alerts when certain conditions are met.
Here at Ibmi Media, as part of our Server Management Services, we regularly help our Customers to perform Redis related tasks.
In this context, we shall look into the steps to monitor Azure Cache for Redis.
The importance of Monitoring Azure Redis Cache?
Azure Cache for Redis provides an in-memory data store based on the open-source software Redis. Several other Azure services. also works in conjunction with Redis Cache
Azure Cache for Redis uses Azure Monitor to provide several options for monitoring the cache instances. We can view metrics, pin metrics charts to the Startboard, customize the date and time range of monitoring charts. Further, it also allows us to add and remove metrics from the charts and set alerts when certain conditions are met.
These tools enable us to monitor the health of the Azure Cache for Redis instances and help us to manage caching applications.
The monitoring challenge becomes important due to the elasticity, dynamic nature, and the number of resources deployed which makes traditional manual/static monitoring impractical if not impossible.
Metrics for Azure Cache for Redis
The Redis INFO command collects the Metrics for Azure Cache for Redis instances approximately twice per minute and automatically stores it for 30 days. It then displays the metrics in the metrics charts and the alert rules evaluate them.
To view cache metrics, browse to the cache instance in the Azure portal. Azure Cache for Redis provides some built-in charts on the Overview blade and the Redis metrics blade. Each chart can be customized by adding or removing metrics and changing the reporting interval.
View pre-configured metrics charts
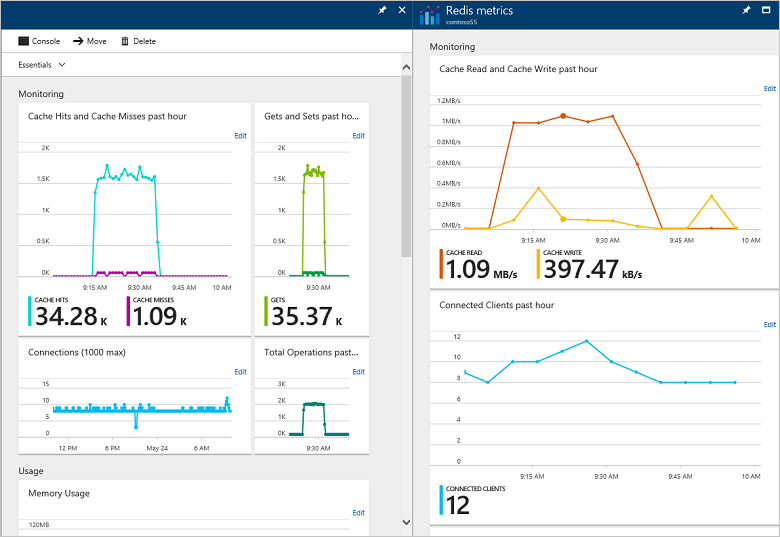
The Overview blade has the following pre-configured monitoring charts.
i. Monitoring charts
ii. Usage charts
i. Monitoring charts- The Monitoring section in the Overview blade has Hits and Misses, Gets and Sets, Connections, and Total Commands charts.
ii. Usage charts- The Usage section in the Overview blade has Redis Server Load, Memory Usage, Network Bandwidth, and CPU Usage charts, and also displays the Pricing tier for the cache instance.
How to View metrics with Azure monitor ?
To view Redis metrics and create custom charts using Azure Monitor, click Metrics from the Resource menu, and customize the chart using the desired metrics, reporting interval, chart type, and so on.
How to Export cache metrics ?
By default, cache metrics in Azure Monitor are stored for 30 days and then deleted. To keep it for longer than 30 days, we can designate a storage account and specify a Retention (days) policy for your cache metrics.
To configure a storage account for your cache metrics:
1. In the Azure Cache for Redis page, under the Monitoring heading, select Diagnostics.
2.Select + Add diagnostic setting.
3. Name the settings.
4. Check Archive to a storage account. You will be charged normal data rates for storage and transactions when you send diagnostics to a storage account.
5. Select Configure to choose the storage account in which to store the cache metrics.
6. Under the table heading metric, checkbox beside the line items you want to store, such as AllMetrics. Specify a Retention (days) policy. The maximum day retention we can specify is 365 days. However, if you want to retain the metrics data forever, set Retention (days) to 0.
7. Click Save.
In addition to archiving the cache metrics to the storage, we can also stream them to an Event Hub or send them to Azure Monitor logs.
To access the metrics, we can view them in the Azure portal, and can also access them using the Azure Monitor Metrics REST API.
If we change storage accounts, the data in the previously configured storage account remains available for download, but it is not displayed in the Azure portal.
Available metrics and reporting intervals
Cache metrics are reported using several reporting intervals, including Past hour, Today, Past week, and Custom. The Metric blade for each metrics chart displays the average, minimum, and maximum values for each metric in the chart. Further, some metrics display a total for the reporting interval.
Each metric includes two versions. First metric measures performance for the entire cache, and for caches that use clustering. The second version of the metric includes (Shard 0-9) in the name measures performance for a single shard in a cache.
For example, if a cache has four shards, Cache Hits is the total number of hits for the entire cache. Cache Hits (Shard 3) is just the hits for that shard of the cache.
Even when the cache is idle with no connected active client applications, we may see some cache activity, such as connected clients, memory usage, and operations being performed. This activity is normal during the operation of an Azure Cache for Redis instance.
Alerts on metrics and activity logs
We can configure to receive alerts based on metrics and activity logs. Azure Monitor allows us to configure an alert to send an email notification, call a webhook or invoke an Azure Logic App when it triggers.
To configure Alert rules for cache, click Alert rules from the Resource menu.
Activity Logs of Azure Cache
Activity logs provide insight into the operations that were performed on the Azure Cache for Redis instances. It was previously known as “audit logs” or “operational logs”. Using activity logs, we can determine the “what, who, and when” for any write operations (PUT, POST, DELETE) taken on the Azure Cache for Redis instances.
Activity logs do not include read (GET) operations.
To view activity logs for cache, click Activity logs from the Resource menu.
[Need urgent assistance with Azure Cache for Redis? – We're available 24*7. ]
Conclusion
This article will guide you on how to monitor Azure Cache for Redis. Azure Cache for #Redis uses #Azure Monitor to provide several options for monitoring #cache instances. These include view metrics, pin #metrics charts to the Startboard, customize the date and time range of monitoring charts, and so on.
To Use Azure Redis Cache:
1. Log into Azure port, go to #Databases >> Redis Cache.
2. Create a news Redis Cache.
3. Get the Access Keys to connect with the newly created Redis Cache.
4. Install the #StackExchange.
5. You can add Redis Cache connection string into the appsettings.


