Are you trying to monitor System Metrics with the TICK Stack?
This guide will help you.
TICK Stack is a collection of open source components that combine to deliver a platform for easily storing, visualizing and monitoring time series data such as metrics and events.
Recently, one of our customers asked us to set up a tick stack for real-time analysis of data streams.
TICK Stack can trigger alert events and visualize the entire status of a production line easily.
Here at Ibmi Media, as part of our Server Management Services, we regularly help our Customers to perform System Metrics queries.
In this context, we shall look into how to monitor System Metrics with the TICK Stack on CentOS 7.
TICK Stack for monitoring System Metrics ?
TICK stack can be used to monitor time-series data. It especially fits uses that rely upon triggering events based on constant real-time data streams.
For example, fleet tracking. TICK can monitor the fleet data in real-time and create alert conditions. In addition, it can visualize the fleet in its entirety, creating a real-time dashboard of fleet status.
IoT devices are also a strong point for TICK. Solutions that rely upon IoT devices combining date streams to build an overall view, such as an automated manufacturing line, work well with TICK.
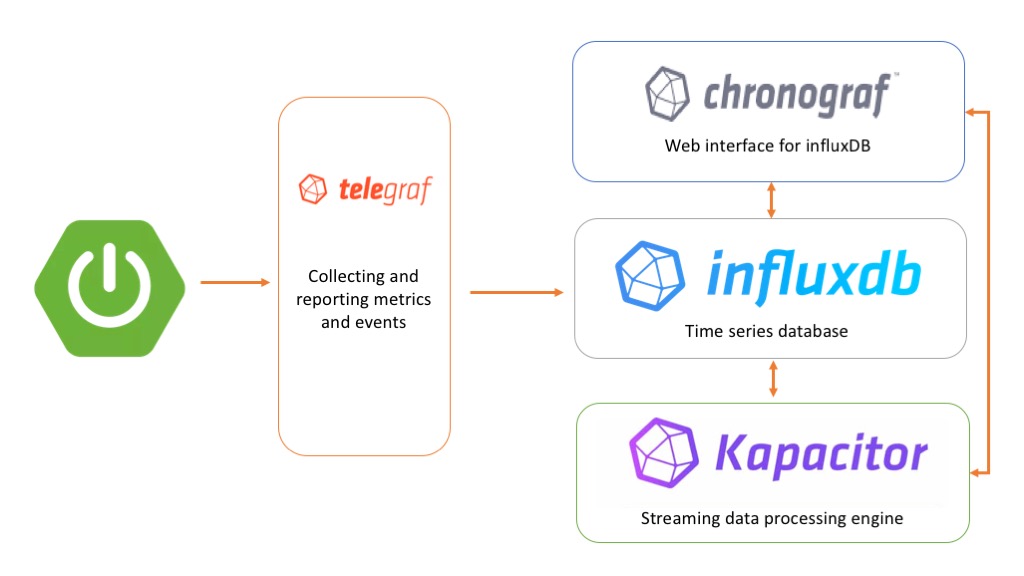
TICK stands for Telegraf, InfluxDB, Chronograf, and Kapacitor.
i. Telegraf collects time-series data from a variety of sources.
ii. InfluxDB stores the time-series data.
iii. Chronograf visualizes and graphs the time-series data.
iv. Kapacitor provides alerts and detects anomalies in time-series data.
Though we can use them separately, if we use them together, we will have a scalable, integrated open-source system for processing time-series data.
How To Monitor System Metrics with the TICK Stack ?
Here, we will use this platform as an open-source monitoring system. We will generate a bit of CPU usage and receive an email alert when the usage gets too high.
In order to begin, our Support Experts suggest having one CentOS 7 server with a Sudo non-root user and a firewall along with a GitHub account to secure the Chronograf user interface.
1. Add TICK Stack Repository
Since all TICK stack components use the same repository, we will set up a repository configuration file to make installation seamless.
To do so, we create a new file:
$ sudo vi /etc/yum.repos.d/influxdata.repoThen we place the following configuration in the new file:
[influxdb]
name = InfluxData Repository – RHEL $releasever
baseurl = https://repos.influxdata.com/rhel/$releasever/$basearch/stable
enabled = 1
gpgcheck = 1
gpgkey = https://repos.influxdata.com/influxdb.key
Eventually, save the file and exit the editor.
2. Install InfluxDB and Configure Authentication
Now we can go ahead and install InfluxDB. It is great for operations monitoring, application metrics, and real-time analytics.
We run the following command to install InfluxDB:
$ sudo yum install influxdbDuring the installation process, it will ask to import a GPG key. Confirm that so the installation can continue.
Once done, we start the InfluxDB service:
$ sudo systemctl start influxdbIn order to ensure the service is running properly, we run:
$ systemctl status influxdbOur output verifying that the service is running will look like this:
[secondary_label Output
● influxdb.service – InfluxDB is an open-source, distributed, time series database
Loaded: loaded (/usr/lib/systemd/system/influxdb.service; enabled; vendor preset: disabled)
Active: active (running) since Tue 2017-02-07 13:19:31 EET; 2min 46s ago
Docs: https://docs.influxdata.com/influxdb/
Main PID: 14290 (influxd)
However, we have to enable user authentication to restrict access to the database.
To do so, we will create at least one admin user.
We start the InfluxDB console:
$ influxThe following command will create a new admin user with user ibmimedia and password ibmimedia_admin:
> CREATE USER “ibmimedia” WITH PASSWORD ‘ibmimedia_admin’ WITH ALL PRIVILEGESWe can verify the user using:
> show usersWe will see the following output:
user admin
—- —–
ibmimedia true
Now we can exit the InfluxDB console:
> exitThen we open the file /etc/influxdb/influxdb.conf in a text editor. This is the configuration file for InfluxDB.
$ sudo vi /etc/influxdb/influxdb.confWe locate the [http] section, uncomment the auth-enabled option, and set its value to true:
…
[http]
# Determines whether HTTP endpoint is enabled.
# enabled = true
# The bind address used by the HTTP service.
# bind-address = “:8086”
# Determines whether HTTP authentication is enabled.
auth-enabled = true
…
Eventually, we save the file, exit the editor and restart the InfluxDB service:
$ sudo systemctl restart influxdbInfluxDB is now configured.
Moving ahead, let us install Telegraf, an agent for collecting metrics.
3. Install and Configure Telegraf
We run the following command to install Telegraf:
$ sudo yum install telegrafIt uses plugins to input and output data. Since we have enabled user authentication for InfluxDB, we have to modify Telegraf’s configuration file to specify the username and password we have configured.
To do so, we open the Telegraf configuration file in a text editor:
$ sudo vi /etc/telegraf/telegraf.confLocate the [outputs.influxdb] section and provide the username and password:
[[outputs.influxdb]]
## The full HTTP or UDP endpoint URL for your InfluxDB instance.
## Multiple urls can be specified as part of the same cluster,
## this means that only ONE of the urls will be written to each interval.
# urls = [“udp://localhost:8089”] # UDP endpoint example
urls = [“http://localhost:8086”] # required
## The target database for metrics (telegraf will create it if not exists).
database = “telegraf” # required
…
## Write timeout (for the InfluxDB client), formatted as a string.
## If not provided, will default to 5s. 0s means no timeout (not recommended).
timeout = “5s”
username = “ibmimedia”
password = “ibmimedia_admin”
## Set the user agent for HTTP POSTs (can be useful for log differentiation)
# user_agent = “telegraf”
## Set UDP payload size, defaults to InfluxDB UDP Client default (512 bytes)
# udp_payload = 512Eventually, we save the file, exit the editor, and start Telegraf:
$ sudo systemctl start telegrafThen check whether the service is running properly:
$ systemctl status telegrafOur output will be like this:
Output
● telegraf.service – The plugin-driven server agent for reporting metrics into InfluxDB
Loaded: loaded (/usr/lib/systemd/system/telegraf.service; enabled; vendor preset: disabled)
Active: active (running) since Tue 2017-02-07 13:32:36 EET; 3min 27s ago
Docs: https://github.com/influxdata/telegraf
Main PID: 14412 (telegraf)
Telegraf is now collecting data and writing it to InfluxDB.
To see which measurements Telegraf is storing in the database from the InfluxDB console, connect with the username and password already configured:
$ influx -username ‘ibmimedia’ -password ‘ibmimedia_admin’Once logged in, to see the available databases we execute:
> show databasesWe will see the Telegraf database in the output:
name: databases
name
—-
_internal
telegraf
If not, check the Telegraf settings we configured to ensure we have specified the proper username and password.
To see what Telegraf is storing in that database, execute the following command:
> use telegrafSimilarly, to display the various measurements Telegraf has collected, we execute:
> show measurementsWe will see the following output:
name: measurements
name
—-
cpu
disk
diskio
kernel
mem
processes
swap
system
There are more than 60 input plugins for Telegraf. It can gather metrics from many popular services and databases.
We can view usage instructions for each input plugin by running the below command:
$ telegraf -usage plugin-nameAnd to exit the InfluxDB console:
> exitSince Telegraf is storing measurements, let us set up Kapacitor to process the data.
4. Install Kapacitor
Kapacitor is a data processing engine. We will use Kapacitor to read data from InfluxDB, generate alerts, and send those alerts to a specified email address.
Initially, we will install Kapacitor:
$ sudo yum install kapacitorThen we open the Kapacitor configuration file in a text editor:
$ sudo vi /etc/kapacitor/kapacitor.confLocate the [[influxdb]] section and provide the username and password to connect to the InfluxDB database:
# Multiple InfluxDB configurations can be defined.
# Exactly one must be marked as the default.
# Each one will be given a name and can be referenced in batch queries and InfluxDBOut nodes.
[[influxdb]]
# Connect to an InfluxDB cluster
# Kapacitor can subscribe, query and write to this cluster.
# Using InfluxDB is not required and can be disabled.
enabled = true
default = true
name = “localhost”
urls = [“http://localhost:8086”]
username = “sammy”
password = “sammy_admin”
…
Eventually, save the file, exit the editor and start Kapacitor:
$ sudo systemctl daemon-reload
$ sudo systemctl start kapacitor
We check Kapacitor’s task list with the following command:
$ kapacitor list tasksIf Kapacitor is up and running, we will see an empty list of tasks, like this:
Output
ID Type Status Executing Databases and Retention Policies
Once done, we will install the user interface component of the TICK stack to see some results and configure some alerts.
5. Install and Configure Chronograf
Chronograf is a graphing and visualization application that provides tools to visualize monitoring data and create alerting and automation rules.
First, we download and install the latest package:
$ wget https://dl.influxdata.com/chronograf/releases/chronograf-1.2.0~beta3.x86_64.rpm
$ sudo yum localinstall chronograf-1.2.0~beta3.x86_64.rpm
Then we start the Chronograf service:
$ sudo systemctl start chronografIf we are using FirewallD, configure it to allow connections to port 8888:
$ sudo firewall-cmd –zone=public –permanent –add-port=8888/tcp
$ sudo firewall-cmd –reload
We can access the Chronograf interface by visiting http://our_server_ip:8888 in the web browser.
On the welcome page, enter the username and password for the InfluxDB database and click Connect New Source to proceed.
Once connected, we will see a list of hosts. Click on the hostname for the server to open a dashboard with a series of system-level graphs.
Moving ahead, let us connect Chronograf to Kapacitor to set up an alert.
Hover over the last item in the left navigation menu and click Kapacitor to open the configuration page.
We use the default connection details. Then click on Connect Kapacitor.
We will see the Configure Alert Endpoints section appear below the form.
Kapacitor supports multiple alert endpoints. However, the simplest communication method is SMTP, which is selected by default.
Fill in the From email field with the address from which alerts will be sent and click Save.
The rest of the details can be the default values.
6. Configure Alerts
With the configuration in place, let us set up a simple alert that looks for high CPU usage.
In the left navigation menu, find the ALERTING section >> Kapacitor Rules >> Create New Rule.
Initially, click on telegraf.autogen to select the time-series. Select the System from the list that appears.
Then select load1. We will immediately see a corresponding graph in the section below.
Above the graph, locate the field that says Send Alert where load1 is Greater Than and enter 1.0 for the value.
Then paste the following text into the Alert Message field to configure the text of the alert message:
{{ .ID }} is {{ .Level }} value: {{ index .Fields “value” }}If we hover the mouse over the entries in the Templates section we get descriptions of each field.
Then choose the Smtp option from the Send this Alert to dropdown list and enter the email address in the associated field.
By default, we will receive messages in the JSON format, like this:
{
“Name”:”system”,
“TaskName”:”chronograf-v1-50c67090-d74d-42ba-a47e-45ba7268619f”,
“Group”:”nil”,
“Tags”:{
“host”:”centos-tick”
},
“ID”:”TEST:nil”,
“Fields”:{
“value”:1.25
},
“Level”:”CRITICAL”,
“Time”:”2017-03-08T12:09:30Z”,
“Message”:”TEST:nil is CRITICAL value: 1.25″
}
We can set up more human-readable messages for the mail alerts.
To do this, enter the message in the text box with the Put email body text here placeholder.
Finally, click Save Rule on the top right to finish configuring this rule.
To test the alert, we create a CPU spike using the dd command to read data from /dev/zero and send it to /dev/null:
$ dd if=/dev/zero of=/dev/nullAfter several minutes, it will create a spike.
After a while, we will receive an e-mail message. Additionally, we can see all the alerts by clicking Alert history in the left navigation menu of the Chronograf user interface.
Once we verify that we can receive alerts, make sure to stop the dd command with CTRL+C.
We have got alerts running, but anyone can log into Chronograf. Let us restrict access.
7. Secure Chronograf with OAuth
By default, anyone who knows the address of the server running the Chronograf application can view any data. It is acceptable for the testing environment but not for production.
We will configure logging in via a GitHub account, so we will need one to proceed.
i. First, we register a new application with GitHub.
ii. Log into the GitHub account and navigate to https://github.com/settings/applications/new.
iii. Then fill in the form with the following details:
Application name with Chronograf or a suitable descriptive name.
For Homepage URL, use http://our_server_ip:8888.
Authorization callback URL with http://our_server_ip:8888/oauth/github/callback.
iv. Then click the Register application to save the settings.
v. Copy the Client ID and Client Secret values provided on the next screen.
vi. Next, edit Chronograf’s systemd script to enable authentication. Open the file /usr/lib/systemd/system/chronograf.service:
$ sudo vi /usr/lib/systemd/system/chronograf.service
vii. Then locate the [Service] section and edit the line starting with ExecStart=:
[Service]
User=chronograf
Group=chronograf
ExecStart=/usr/bin/chronograf –host 0.0.0.0 –port 8888 -b /var/lib/chronograf/chronograf-v1.db -c /usr/share/chronograf/canned -t 'secret_token' -i 'our_github_client_id' -s 'our_github_client_secret' -o 'our_github_organization'
KillMode=control-group
Restart=on-failure
All OAuth providers require the secret_token. Set it to a random string. Use the Github Client ID, Github Client Secret, and Github Organization for the other values.
Create a Github organization and add the appropriate users to the organization to restrict access.
Otherwise, any Github user will be able to log in to the Chronograf instance.
Then save the file, exit the editor and restart the Chronograf service:
$ sudo systemctl daemon-reload
$ sudo systemctl restart chronograf
Open http://our_server_ip:8888 to access the Chronograf interface.
This time we will have a Login with Github button. Click the button to log in which will ask to allow the application to access the Github account.
Once we allow access, we will be logged in.
[Need help with Tick Stack setup? We'd be happy to assist you. ]
Conclusion
This article will guide you on how the TICK stack can be a powerful tool for storing, analyzing, and visualizing time series data. To monitor InfluxDB _internal metrics in a production #cluster, use Telegraf and the influxdb input plugin to capture these metrics from the InfluxDB /debug/vars endpoint and store them in an external InfluxDB monitoring instance.
More about Kapacitor:
#Kapacitor is a native data processing engine for #InfluxDB 1. x and is an integrated component in the InfluxDB 2.0 platform.
Kapacitor can process both stream and batch data from InfluxDB, acting on this data in real-time via its programming language TICKscript.
A retention policy (RP) is the part of InfluxDB data structure that describes for how long InfluxDB keeps data.
InfluxDB compares your local server's timestamp to the timestamps on your data and deletes data that are older than the RP's DURATION .
A single database can have several RPs and RPs are unique per database.


