Are you trying to use Perfmon counters for Disk Usage?
This guide is for you.
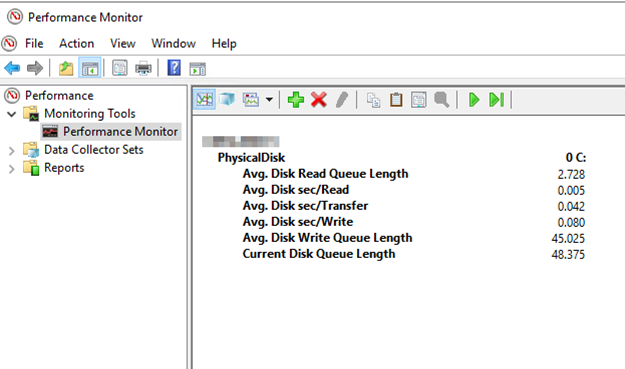
Performance Monitor (PerfMon) is a tool that comes built-in with Windows and allows you to look into the performance of your system and the applications that are running on it. It gives you a way to view data points that are associated with these applications and link them with the effect they have on your system.
Problems regarding Disk I/O are usually difficult to diagnose and debug. Perfmon disk counters help us to diagnose disk issues.
Here at Ibmi Media, as part of our Server Management Services, we regularly help our Customers to perfmon counters queries using SQL.
In this context, we shall look into some top performance counters to identify SQL server disk bottleneck.
Perfmon counters to identify SQL server disk bottleneck
We will see some top counters that are used to identify the disk usage of a SQL server.
The values for all disk counters can split into three categories – Excellent, Good, and Poor.
i. Excellent – Disk Subsystem is responding perfectly for the respective counter.
ii. Good – Disk Subsystem is responding fairly for respective counter and can be considered good considering your workload and other resource utilization.
iii. Poor – Disk Subsystem is not responding well for respective counter and it requires your intervention to drill down more to understand the reason behind slowness.
Important perfmon disk counters are given below:
1. Average Disk Sec/Read
2. Average Disk Sec/Write
3. Average Disk Sec/Transfer
4. Average Disk Queue Length
5. Current Disk Queue Length
6. Disk Read/Sec and Disk Write/Sec
7. %Disk Time
8. %Idle Time
1. Average Disk Sec/Read
Average Disk Sec/Read is an important perfmon disk counter that shows the average time in seconds that is needed to read data from the disk. Also, it explains the disk latency.
We can find these counters at the logical and physical disk object level. The value for this counter is generally the number of seconds it takes to do each read. The shorter the time needed to read or write data, the faster the system.
If we get a counter value of more than 20ms, it means that our disk is not performing well.
The disk performance is:
i. Excellent, if the value of this counter is less than 6 milliseconds (0.006 sec)
ii. Good, if the value of this counter is up to 15 milliseconds (0.015 sec)
iii. Poor, if the value is constantly more than 15 milliseconds (0.015 sec)
2. Average Disk Sec/Write
Average Disk Sec/Write is also an important counter that shows the average time in seconds that is needed to write data to disk. Also, it explains the disk latency.
This counter can be tracked at the logical and physical disk level. The value for this counter is generally the number of seconds it takes to do each read. The shorter the time needed to read or write data, the faster the system.
If we constantly get a counter value of more than 20ms then it means our disk is not performing well.
The disk performance is:
i. Excellent, if the value of this counter is less than 6 milliseconds
ii. Good, if the value of this counter is up to 15 milliseconds
iii. Poor, if the value is constantly more than 15 milliseconds.
3. Average Disk Sec/Transfer
Average Disk Sec/Transfer is a time that measures average latency for read or write operations.
If the Average Disk Sec/Transfer value increases, this indicates that the I/O subsystem is not optimally keeping up with the I/O demand.
This counter is available under the Logical Disk and Physical Disk object.
The disk performance is:
i. Excellent, if the value of this counter is less than 6 milliseconds
ii. Good, if the value of this counter is up to 15 milliseconds
iii. Poor, if the value is constantly more than 15 milliseconds.
4. Average Disk Queue Length
Average Disk Queue Length counter shows us the average number of read and write requests that were queued on the selected physical disk.
If this value is exceeding its threshold frequently then we should also look at other perfmon disk counters Average Disk Read Queue Length and Average Disk Write Queue Length.
This helps us to diagnose whether the Average Disk Queue Length is high due to high read or high write operation. The recommended value for this counter is less than 2 per individual disk.
The disk performance is:
i. Excellent, if the value of this counter is less than 1.5 per drive.
ii. Good, if the value of this counter is up to 2 per drive.
iii. Poor, if the value is constantly more than 2 per drive.
5. Current Disk Queue Length
Current Disk Queue Length is the number of disk requests that are currently waiting as well as requests currently being serviced.
The difference between average disk queue length and current queue length is CDQL tells current load whereas ADQL tells load during a given time frame.
The Current Disk Queue Length metric in Windows Performance Monitor is available for both physical and logical disk. The Current Disk Queue Length value should be less than 2 per disk.
The disk performance is:
i. Excellent, if the value of this counter is less than 1.5 per drive.
ii. Good, if the value of this counter is up to 2 per drive.
iii. Poor, if the value is constantly more than 2 per drive.
6. Disk Read/Sec and Disk Write/Sec
Disk Reads/sec and Disk Writes/Sec shows us the number of read and write operations happening per second on the disk. If we want to benchmark disk capacity we can do it by gradually increasing the load on the system.
The disk performance is:
i. Excellent, if the value of this counter is less than 75% of total disk capacity.
ii. Good, if the value of this counter is up to 85% of total disk capacity.
iii. Poor, if the value is constantly more than 85% of total disk capacity.
7. %Disk Time
%Disk Time counter tells us how busy the disk is in performing read and write operations.
It shows the values as a normal one even the disk has a serious disk performance issue. So we should compare its value with the current/average disk queue length before reaching to any conclusion about disk issue.
The disk performance is:
i. Excellent, if the value of this counter is less than 75% of total disk capacity.
ii. Good, if the value of this counter is up to 85% of total disk capacity.
iii. Poor, if the value is constantly more than 85% of total disk capacity.
8. %Idle Time
%Idle Time measures the percentage of time the disk was idle during the sample interval.
The disk is idle when it is not processing any read and write requests.
If we constantly get its value less than 40%, we can either move some applications from our machine to another machine if we are running other applications apart from SQL Server or we can change the current disk system with a new and faster disk system.
The disk performance is:
i. Excellent, if the value of this counter is greater than 60% of total disk capacity.
ii. Good, if the value of this counter is greater than 50% of total disk capacity.
iii. Poor, if the value is constantly less than 40% of total disk capacity.
[Need urgent assistance to use Perfmon counters for Disk Usage? We are happy to help you. ]
Conclusion
This article will guide you on use performance counters (#Perfmon) to identify SQL server disk bottlenecks.
The performance impact is negligible in updating. Microsoft's intent is that you always write to the performance counters. It's the monitoring of (or capturing of) those performance counters that will cause a degradation of performance. So, only when you use something like perfmon to capture the data.
Reliability #Monitor shows you your system stability history at a glance and lets you see details on a day-by-day basis about events that impact reliability. Reliability Monitor provides a quick view of how stability the system has been.
1. The Performance Monitor is primarily for viewing real time #statistics.
2. By default only one counter is selected; the %Processor Time counter. However you can add additional counters by clicking on the green plus sign.
3. This will allow you to monitor any counters you wish in real time.
4. Difference Between Performance Monitor and #Resource Monitor is that a performance monitor is a program that assesses and reports information about various computer resources and devices.
5. While Resource Monitor is a tool by which you can monitor the usage of your CPU.


