Are you trying to troubleshoot Redis latency problems?
This guide is for you.
Redis is an open-source, networked software project that implements data structure servers.
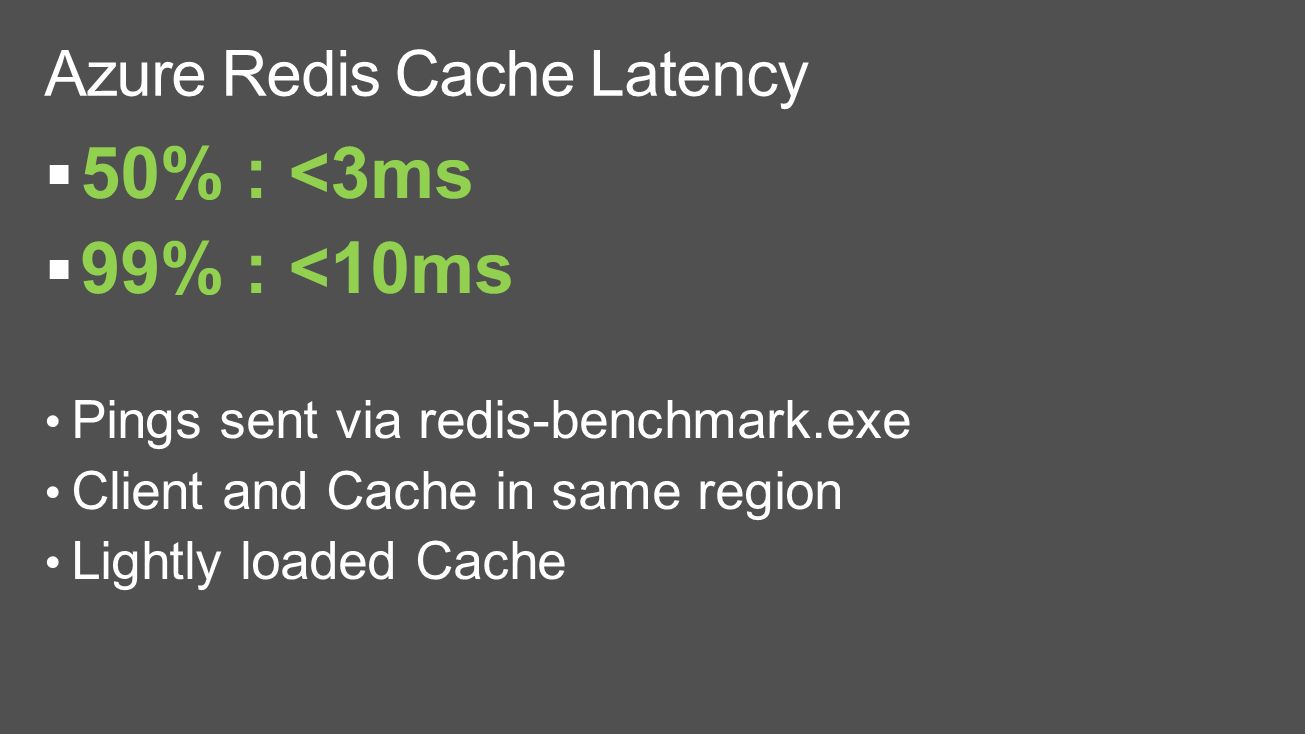
The processing time for Redis is normally low. But certain conditions at times create latency problems in Redis.
Latency is the maximum delay between the time a client issues a command and the time the reply to the command is received by the client.
Here at Ibmi Media, as part of our Server Management Services, we regularly help our Customers to resolve Redis related errors.
In this context, we shall look into how to troubleshoot Redis latency problems.
How to measure latency?
Before going into the steps to troubleshoot Redis latency problems, we will see how to measure latency.
The latency of a Redis server can be measured in milliseconds with redis-cli command below:
redis-cli --latency -h `host` -p `port`Redis provides latency monitoring capabilities that help to understand where the server is blocking.
By default, monitoring will be disabled. So, before enabling the latency monitor we need to set the latency threshold in milliseconds.
We can enable the latency monitor at runtime in a production server using the following command:
CONFIG SET latency-monitor-threshold 100We can set any threshold according to our needs. For instance, if the maximum acceptable latency is 100 milliseconds, the threshold should be set to a value such that it will log all the events blocking the server for a time equal or greater to 100 milliseconds.
Types of Redis Latency ?
Some types of Redis Latency are given below:
1. Intrinsic latency
Intrinsic latency is a kind of latency that is inherently part of the environment that runs Redis.
The operating system kernel and the hypervisor provide it.
We can measure it with the following commands:
$ ./redis-cli --intrinsic-latency 100
Max latency so far: 1 microseconds.
Max latency so far: 16 microseconds.
Max latency so far: 50 microseconds.
Max latency so far: 53 microseconds.
Max latency so far: 83 microseconds.
Max latency so far: 115 microseconds.
Here the argument 100 is the number of seconds the test will be executed. The more time we run the test, the more likely we will be able to spot latency spikes.
In the above example, the intrinsic latency of the system is just 0.115 milliseconds (or 115 microseconds).
2. Redis Latency by network and communication
We can connect to Redis using a TCP/IP connection or a Unix domain connection. The typical latency of a 1 Gbit/s network is about 200 us, while the latency with a Unix domain socket can be as low as 30 us.
It actually depends on the network and system hardware.
We can therefore try to limit the number of roundtrips by pipelining several commands together. Most of the clients and servers support this.
3. Latency by slow commands
While executing a single thread when a request is slow to serve all the other clients will have to wait for this request.
While executing normal commands, this will not happen at all since these commands are executed in constant (and very small) time.
The algorithmic complexity of all commands is documented. A good practice is to systematically check it when using commands we are not familiar with.
We should not use slow commands against values composed of many elements to get rid of latency. And we should run a replica using Redis replication where we can run all slow queries.
4. Redis Latency by fork
Redis has to fork background processes in order to generate the RDB file in the background. The fork operation (running in the main thread) can induce latency by itself.
Forking is an expensive operation on most Unix-like systems as it involves copying some objects linked to the process.
However, new types of EC2 HVM based instances are much better with fork times.
5. Latency by transparent huge pages
Unfortunately, when a Linux kernel uses transparent huge pages, Redis incurs a big latency penalty after the fork call.
To get rid of this latency we can make sure to disable transparent huge pages using the following command:
echo never > /sys/kernel/mm/transparent_hugepage/enabled6. Swapping causes latency
Linux is able to relocate memory pages from the memory to the disk, and vice versa, in order to use the system memory efficiently.
If a Redis page is moved by the kernel from the memory to the swap file, when the data stored in this memory page is used by Redis, the kernel will stop the Redis process in order to move the page back into the main memory.
This is a slow operation involving random I/Os and will result in anomalous latency of Redis clients.
Linux offers proper tools to investigate this issue. The first thing to do is to check the amount of Redis memory that is swapped on the disk.
If the latency problem is due to Redis memory being swapped on the disk we will have to lower the memory pressure in our system.
This can be done either by adding more RAM if Redis is using more memory than the available one or we can avoid running other memory-consuming processes in the same system.
7. Redis Latency due to AOF and disk I/O
Another source of latency is due to the Append Only File support on Redis.
For latency issues related to the append-only file we can use the following strace command:
sudo strace -p $(pidof redis-server) -T -e trace=fdatasyncThe above command will show all the fdatasync(2) system calls performed by Redis in the main thread.
We saw types of latency that cause Redis latency problems.
Next, we will see the steps that we can follow to get low latency.
Steps to run Redis with low latency ?
To run Redis in a low latency fashion, follow the steps given below:
1. Ensure not to run slow commands that will block the server. Use the Redis Slow Log feature to check this.
2. For EC2 users, make sure to use HVM based modern EC2 instances, like m3.medium. Otherwise, fork() is too slow.
3. Disable Transparent huge pages from the kernel.
4. Use Redis software watchdog to track latency problems that escaped an analysis using normal tools.
5. Enable and use the Latency monitor feature of Redis in order to get a human-readable description of the latency events and causes.
[Need urgent assistance to fix Redis related errors? We are happy to help you! ]
Conclusion
This article will guide you on steps to troubleshoot Redis #latency problems.
#Amazon #ElastiCache allows you to seamlessly set up, run, and scale popular open-source compatible in-memory data stores in the cloud.
Build data-intensive apps or boost the performance of your existing databases by retrieving data from high throughput and low latency in-memory data stores.
#Redis #performance monitoring metrics:
1. Used Memory
"memory_used" gives the total amount of memory in bytes that is used by the Redis server. If it exceeds physical memory, system will start swapping causing severe performance degradation.
2. Peak used memory
"memory_used_peak" metric calculates and displays the highest amount of memory in bytes consumed by the Redis server.
3. Used CPU system
The metric "cpu_used_sys" gets the total amount of system CPU consumed by the Redis server. High CPU usage is not bad as long as it doesn't exceed CPU limit.
4. Used CPU user
The metric "cpu_used_user" records the total amount of user CPU consumed by the Redis server.
5. Used CPU user children
The metric "cpu_used_user_children" records the total amount of user CPU consumed by other background processes.
6. Used CPU system children
Get the total amount of system #CPU consumed by background processes with the metric "cpu_used_sys_children".
7. Rejected connections
Use the metric "total_conn_rec" and get the total number of connections accepted by the Redis server.
8. Connected clients
Get the total number of slave connections made to the Redis server with the metric "conn_slaves".
