Need to set up Inputs in Nagios Log Server?
This guide is for you.
Here at Ibmi Media, as part of our Server Management Services, we regularly help our Customers to configure inputs in Nagios Log Server.
In this context, we shall look into configuring Nagios log Server.
How does Inputs help Nagios log Server?
Before going to the steps to configure Nagios log Server let us take a glimpse at what inputs are.
Inputs allow Nagios Log Server to collect data from various places, like TCP/UDP ports, SNMP Traps, Unix sockets, long-running command pipes, and so on.
What does Input Configuration Location mean?
Nagios Log Server is a cluster oriented application that uses Logstash to receive and process logs.
The basic configuration available after the default installation of Nagios Log Server has all the inputs defined as part of the Global Config.
Global Config is an easy way to set up the same Logstash configuration on all instances.
Steps to access the Nagios log server configuration:
1. First, go to Configure.
2. Then take Global (All Instances) and go to Global Config.
How to Configure inputs in nagios log server? – Its configuration options
To configure Inputs in Nagios Log Server we will first see what are the inputs available.
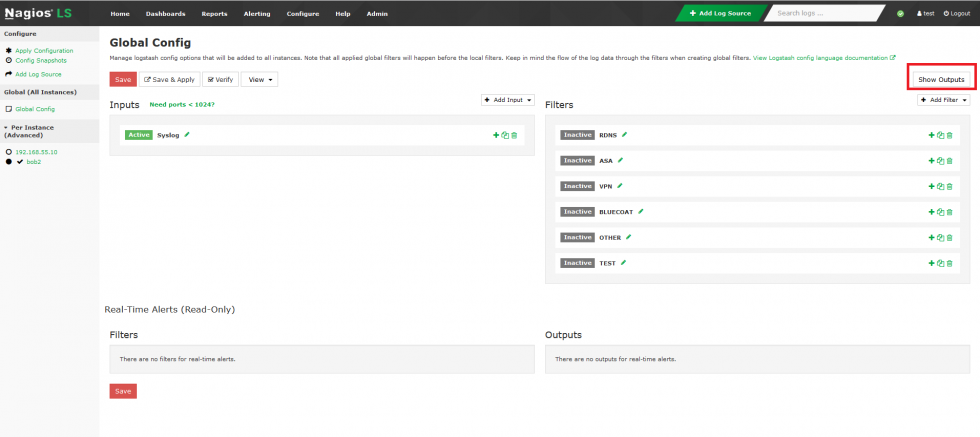
On the Global Config page, we can find two main tables named Inputs and Filters also there will be a third table called Outputs which is hidden.
Inputs, Filters and Outputs are all used by Logstash to process incoming log data and normally store it in the Elasticsearch database.
In the Inputs table, there are several pre-configured inputs that come as part of Nagios Log Sever known as blocks.
Icons available in the Input Blocks
We can see some Input blocks available and how our support engineers enable them to configure Inputs in Nagios Log Server.
The pre-configured input blocks can be considered as Active if it is shown as Active by the box next to each input.
Then to disable this we can click the Active box to mark it as Inactive.
The following are the icons available:
1. Rename
Allows to rename the block.
We can click the Active box to mark it as Inactive. Clicking the box again will toggle it back to Active.
2. Open/Close
We can use its to expand the block to show the input configuration in a text field.
The icon will change to a hyphen when open, clicking the hyphen will collapse the block.
3. Copy
With this, we can create a duplicate of that block.
Allows to easily create a new input based on the configuration of an existing input.
4. Remove
We can delete a block when it is no longer required by using Remove.
Any changes that we make will not be saved until we click the Save button.
5. Input Structure
The inputs are a structured format like this:
{
<config_option> => <config_value>
<config_option> => <config_value>
}
<plugin> is the name of the plugin that we wish to enable. Each plugin can have multiple <config_option> defined, depending on the requirements.
6. Two plugins possible in Logstash are:
i. Using the syslog plugin that is configured by default in Nagios Log Server.
{
type => 'syslog'
port => 5544
}
ii. Using the file plugin
file {
type => 'syslog'
path => ['/log/file/location/*.log']
start_position => 'beginning'
add_field => { 'program' => 'your_program' }
}
7. Adding An Input
Click the Add Input drop-down list and select Custom.
We can see a new block appearing at the bottom of the list of Inputs.
Type a unique name for the input.
In the text field, we will need to define the input configuration. Here is an example for a local file on the Nagios Log Server machine itself:
file {
type => "testing"
path => "/tmp/test.log"
}
Once it is finished, click the Save button.
[Need further assistance with Nagios queries? We are here for you!]
How to Apply Nagios log Server Configuration?
For the new input to become active, we will need to apply the configuration.
We must verify the configuration first and then put the new input into the running configuration, so it can be tested.
Steps to apply the Inputs in Nagios Log configuration:
1. First take the Configure option.
2. Then click Apply Configuration.
3. And click the Apply button.
4. After that click the Yes, Apply Now button.
We need to wait while the configuration is applied. When it completes the screen will refresh with a completed message.
How to Test Input in Nagios log Server?
After applying the configuration we can check whether the Inputs given in Nagios Log Server works fine.
Steps to confirm the input is working:
1. Open a terminal session to Nagios Log Server instance and then execute the following command:
echo "This is a test log entry" >> /tmp/test.log2. Next in Nagios Log Server, open the Dashboards page and perform the query type:testing. The query will return one result in the ALL EVENTS panel.
3. After this, while clicking on the log entry we can see all details about the entry.
4. If we wish to create the Input as part of the Global Config, then we will have to create a firewall rule on all the instances in Nagios Log Server cluster.
[Sill facing issues working with Nagios log Server Configuration? We are here for you!]
Conclusion
This article will guide you on how to configure inputs in nagios log server via different methods.
This article will guide you on how to configure inputs in nagios log server via different methods.


