Procmail Suspicious rcfile message
This article covers how to resolve the error, Procmail: Suspicious rcfile message, though not a big issue, relates to file permission.
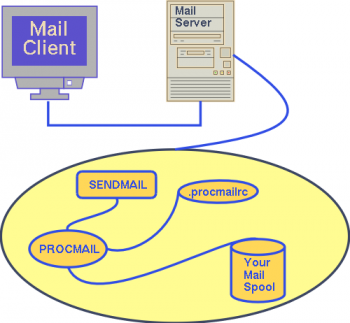
Procmail is autonomous mail processor.
#Procmail should be invoked automatically over the .forward file mechanism as soon as mail arrives.
It starts to look for a file named $HOME/.procmailrc.
formail is a filter that can be used to format mail into mailbox format
lockfile is a utility that can lock a file for single use interactively or in a script
mailstat prints a summary report of mail that has been filtered by procmail since the last time mailstat was ran
procmail is an autonomous mail processor. It performs all the functions of an MDA (Mail Delivery Agent)
The rcfile can contain a mixture of environment variable assignments (some of which have special meanings to procmail), and recipes.
This is not really a big problem. It is related to file permission.
Use chmod command (change file access permissions) to fix problem (assuming that your user name is vivek):
$ chmod 0640 /home/you/.procmailrc
OR
$ chmod 0640 ~/.procmailrc
Further, make sure the .procmailrc file is owned by you and not by someone else:
$ ls ~/.procmailrc
If file is not owned by you then use chown command to setup correct ownership (if your user name is vivek):
# chown ibmimedia:ibmimedia ~/.procmailrc
Finally make sure your home directory belongs to you only:
$ ls ~
Use chown to setup correct group permission on your home directory:
# chown ibmimedia:ibmimedia /home/ibmimedia
Install OpenBSD As Guest Operating System using KVM virt-install
This article covers how to install OpenBSD as guest operating while using KVM. OpenBSD is well know for focus on security features such as Memory protection, cryptography, randomization and much more in default base installation.
virt-install provides the option of supporting graphics for the guest operating system installation. This is achieved through use of QEMU.
virt-install is a command line tool for creating new KVM, Xen, or Linux container guests using the libvirt hypervisor management library
The virt-install tool provides a number of options that can be passed on the command line.
To see a complete list of options run the following command:
# virt-install --help
Troubleshoot KVM Virtualization Problem
This article covers how to troubleshoot KVM virtualization problem.
Log file locations and tools used to track down #KVM #problems are:
1. $HOME/.virtinst/virt-install.log – virt-install tool log file.
2. $HOME/.virt-manager/virt-manager.log – virt-manager tool log file.
3. /var/log/libvirt/qemu/ – Log files for each running virtual machine. If centos is virtual machine name, than log file is /var/log/libvirt/qemu/centos.log.
You can use the grep and other Linux tools to view this files:
# tail -f /var/log/libvirt/qemu/freebsd.log
# grep something $HOME/.virtinst/virt-install.log
$ sudo tail -f /var/log/libvirt/qemu/openbsd.log
Hyper-V backups can fail for any number of reasons, but there are some things to look for when backups don’t work the way that they are supposed to.
When backups fail, the first thing that you should do is to check the backup logs in an effort to learn more about the problem.
Specifically, you need to determine if the problem is confined to a particular host, a particular virtual machine, or perhaps related to the backup target itself.
Perform Monitoring with PRTG
This article covers how to use #monitoring with PRTG. With PRTG. Today, nearly every business relies on a computer and network infrastructure for internet, internal management, telephone, and email.
Here comes the role of PRTG to ensure that business data flows seamlessly between employees, offices, and customers.
Monitoring availability, bandwidth, and usage of your network is easy when you have PRTG. As a versatile solution, PRTG adapts to your needs and supports you with monitoring your application servers and services as whole and not only separate single aspects of these.
To set up your network monitoring, download the PRTG installer from the Paessler website and follow the steps in the installation wizard, or set up a PRTG Hosted Monitor instance on https://www.paessler.com/prtg-hosted-monitor and install a remote probe in your LAN.
PRTG Network Monitor is Paessler's powerful network monitoring solution.
In #PRTG, you can view Toplists for all xFlow sensors. xFlows are monitoring data pushed from network devices to PRTG.
You can use them to monitor where and how much data is traveling to and from.
This way, they determine which machine, protocol, or user is consuming bandwidth.
Remote probes allow you to monitor different sub-networks that are separated from your PRTG on premises core server by a firewall and to keep an eye on remote locations. You can install one or more remote probes.
The best network monitoring tools:
1. SolarWinds Network Performance Monitor (FREE TRIAL).
2. Datadog Network Performance Monitoring (FREE TRIAL).
3. ManageEngine OpManager (FREE TRIAL).
4. Progress WhatsUp Gold (FREE TRIAL).
5. Site24x7 Network Monitoring (FREE TRIAL).
6. Paessler PRTG Network Monitor (FREE TRIAL).
7. Nagios Core.
8. Zabbix.
Plesk Panel Database issues
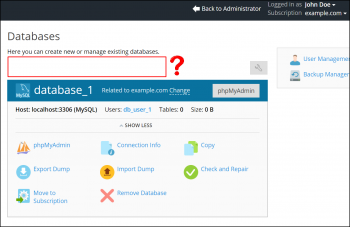
This article covers the different #Plesk database errors. The main reason for database issues in Plesk is the misconfiguration of the PSA database.
Plesk employs the native functionality of database management tools for checking and repairing databases.
For example, for #MySQL databases it uses the mysqlcheck utility.
To check and repair a #database:
1. Go to Websites & Domains > Databases > Check and Repair in a database tools pane.
2. If problems are found, click the link See Details and Resolve.
3. The list of tables and corresponding problems will open.
For MySQL databases, you can choose the tables that you would like to repair.
For Microsoft SQL databases, you can repair an entire database only.
Click Repair Selected (for MySQL) or Repair (for Microsoft SQL).
Nginx ingress on DigitalOcean kubernetes using Helm
This article covers how to set up Nginx ingress on DigitalOcean Kubernetes using Helm. To implement this successfully, an Ingress Controller must be present; its role is to implement the rules by accepting traffic (most likely via a Load Balancer) and routing it to the appropriate Services.
Most Ingress Controllers use only one global Load Balancer for all Ingresses, which is more efficient than creating a Load Balancer per every Service you wish to expose.
To install the Nginx Ingress Controller to your cluster, run the following command:
$ helm install nginx-ingress stable/nginx-ingress --set controller.publishService.enabled=true
This command installs the Nginx Ingress Controller from the stable charts repository, names the Helm release nginx-ingress, and sets the publishService parameter to true.
