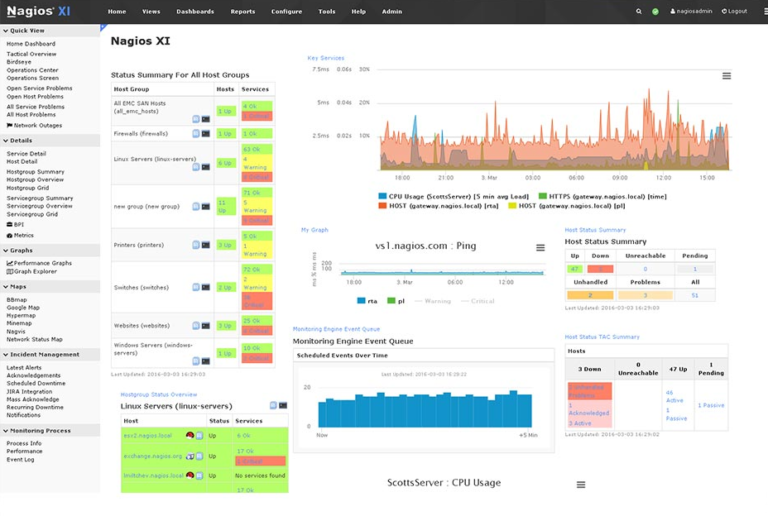
Debugging bandwidth performance graphs in Nagios can be done easily for graphs that are missing or the ones that do not show any performance data.
Here at Ibmi Media, as part of our Server Management Services, we regularly help our Customers to fix Nagios related issues and tasks.
In this context, we shall look into how to debug Bandwidth Performance Graphs in Nagios.
What are the common causes Performance issues in Nagios?
Before going to the steps of debugging bandwidth performance graphs in Nagios let’s see what are the common causes.
Some causes commonly seen are listed below:
1. Cron daemon not running
2. Corrupt configuration files
3. Deprecated MRTG config files causing MTRG to run longer than five minutes
4. No proper file/folder permissions
5. MRTG config files logging errors
6. MTRG running longer than five minutes
7. Command not executing correctly
8. Directory Missing
9. SNMP Configuration Incorrect
How to debug bandwidth performance graphs in Nagios?
Let’s see how debugging bandwidth performance graphs in Nagios is done by our Support Experts.
1. Cron Daemon
We must ensure that the cron daemon is running.
We can check this by running the following command:
RHEL 6|CentOS 6|Oracle Linux 6
# service crond statusRHEL 7|CentOS 7|Oracle Linux 7
# systemctl status crond.serviceUbuntu 14|Debian|Ubuntu 16/18
# service cron status/pre>
# systemctl status cron.service
If the corn daemon is not running, we can start it by running the following command:
RHEL 6|CentOS 6|Oracle Linux 6
# service crond startRHEL 7|CentOS 7|Oracle Linux 7
# systemctl start crond.serviceUbuntu 14
# service cron startDebian|Ubuntu 16/18
# systemctl start cron.service[Need assistance in solving Nagios Performance issues? We can help you!]
2. Corrupt Files/Deprecated Files
Corrupt files could be caused by an unexpected shutdown of the server or if the server’s drive has filled up and could not save the current bandwidth data.
The configuration files are in /etc/mrtg/conf.d/.
To troubleshoot the corrupt files, run the following command and if any errors are displayed, resolve the errors, and re-run the command.
# LANG=C LC_ALL=C /usr/bin/mrtg /etc/mrtg/mrtg.cfgRunning the previous command should highlight any devices that are timing out. Simply delete the config files using the following command:
# rm -f /etc/mrtg/conf.d/196.X.X.X.cfgWe must put the IP address after /conf.d/
3. File/Folder Permissions
Generally, the performance data files are stored in 2 locations on the XI server.
The first folder is /var/lib/mrtg.
This is where the Bandwidth graphs are stored. Here is a sample of what the permissions look like.
-rw-rw-r-- 1 apache nagios 105312 Jan 27 13:25 192.168.5.43_71.rrd
-rw-rw-r-- 1 apache nagios 105312 Jan 27 13:25 192.168.5.43_72.rrd
-rw-rw-r-- 1 apache nagios 105312 Jan 27 13:25 192.168.5.43_73.rrd
-rw-rw-r-- 1 apache nagios 105312 Jan 27 13:25 192.168.5.43_74.rrd
-rw-rw-r-- 1 apache nagios 0 Jan 27 13:25 mrtg.ok
To reset the permissions on the folders and files in /var/lib/mrtg, we can execute the following commands:
RHEL|CentOS|Oracle Linux
# cd /var/lib/mrtg
# chown apache:nagios *
# chmod 0664 *
Debian|Ubuntu
# cd /var/lib/mrtg
# chown www-data:nagios *
# chmod 0664 *
The second folder is at this location:
/usr/local/nagios/share/perfdataThis is where the performance data for all the hosts and services are stored. Here is a sample of what the permissions look like:
drwxrwxr-x 2 nagios nagios 4096 Jan 15 11:29 192.168.1.1
drwxrwxr-x 2 nagios nagios 4096 Jan 27 13:30 192.168.5.43
The permissions of the folder 196.XX.Xlook like this:
-rw-rw-r-- 1 nagios nagios 1534768 Nov 29 13:42 _HOST_.rrd
-rw-rw-r-- 1 nagios nagios 3892 Nov 29 13:42 _HOST_.xml
To reset the permissions on the folders and files in /usr/local/nagios/share/perfdata, execute the following commands:
# cd /usr/local/nagios/share/perfdata
# for folder in `find . -type d`; do chown -R nagios:nagios $folder; done
# for folder in `find . -type d`; do chmod 0775 $folder; done
# for folder in `find . -type d`; do chmod 0664 $folder/*; done
[Still facing Nagios issues? We can help you!]
4. MRTG Config Files Logging Errors
If MRTG faces issue in collecting data from a device, it will log this in the root mailbox.
When a mailbox is not checked regularly it will increase the size and thus slow down MRTG.
To identify any MRTG port having problems, we execute the below command in a terminal session:
# LANG=C LC_ALL=C /usr/bin/mrtg /etc/mrtg/mrtg.cfgWe will get the ports with errors in the output.
We can comment out these ports in the relevant config files by using a hash #. Each port in the config file is 37 lines long, you need to comment out all 37 lines.
5. MRTG Running Longer Than Five Minutes
When MRTG runs it is considered to get complete within five minutes.
If it is still running the next time it runs at the five-minute interval, it will terminate as there is already an MRTG job running.
This means data is not collected from devices at this interval.
We can identify how long it takes for MRTG to run by executing the following command:
# time LANG=C LC_ALL=C /usr/bin/mrtg /etc/mrtg/mrtg.cfgThe output will end with how long the command took to execute.
We can increase the number of forks MRTG is allowed to spawn when it executes to fix this.
In /etc/mrtg/mrtg.cfg as per the following directive:
Forks: 4
Increase the number as required.
6. Command Not Executing Correctly
Try running the command that Nagios XI runs to check the status of a device. Nagios XI uses the check_rrdtraf plugin.
Test running this plugin manually by running a check, similar to the following:
# /usr/local/nagios/libexec/check_rrdtraf -f '/var/lib/mrtg/196.X.X.X_1.rrd' -w 1 -c 2It will return:
OK - Current BW in: 1.57Kbps Out: 365.41bps|in=1.573002Kb/s;1;2 out=365.413424b/s;1;2[Still facing Nagios related issues? We can help you!]
7. Directory Missing
Make sure the /var/lock/mrtg/ directory exists.
We can check the /var/spool/mail/root mailbox using this command:
# grep templock /var/spool/mail/rootIf we get the following error then we have to recreate the /var/lock/mrtg/ folder.
2016-10-03 19:45:02: ERROR: Creating templock /var/lock/mrtg/mrtg_l_5612: No such file or directory at /usr/bin/mrtg line 1961
To recreate the folder using the following command:
# mkdir /var/lock/mrtg8. SNMP Configuration Incorrect
Older versions of the Switch Wizard called MRTG with arguments for SNMPv2c, which MRTG does not use.
Generally, the entries look like this:
Target[www.hostaddress.com]: 1:SNMP_Community_String@www.hostaddress.com:::::2[Need assistance with Ubuntu Tasks? We can help you!]
Conclusion
This article will guide you through the steps to perform #debugging of #bandwidth #performance #graphs in #Nagios.
This article will guide you through the steps to perform #debugging of #bandwidth #performance #graphs in #Nagios.
